Fig. 5.
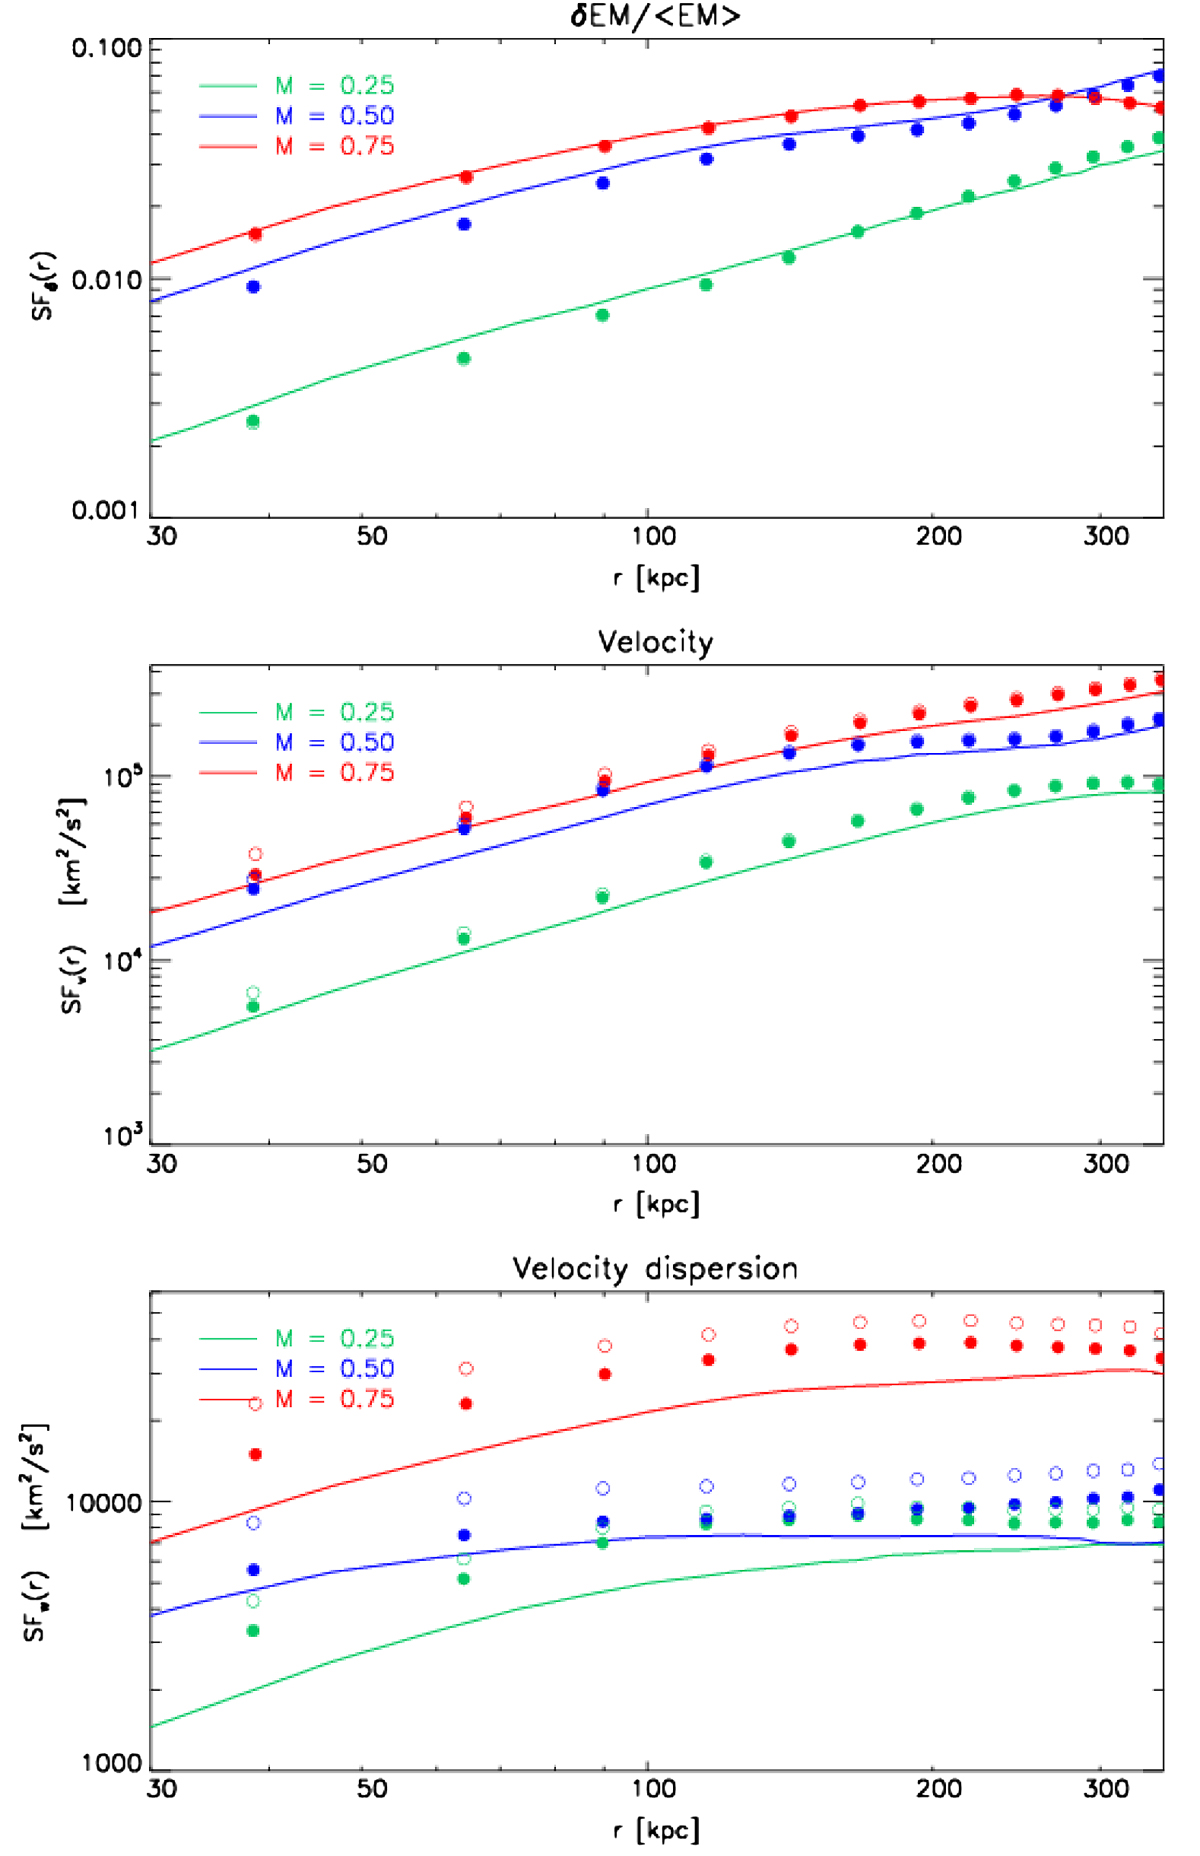
Second-order 2D structure functions of emission measure fluctuations (top panel), velocity (middle panel), and velocity dispersion (bottom panel) as a function of distance for the three ℳ = (0.25, 0.5, 0.75) simulations (green, blue, and red, respectively). In each plot the measured SFs derived from our simulated X-IFU fields (filled dots with error bars) is compared to those of δ, vew, and wew (see definitions in Eqs. (3), (5), and (6)) derived directly from the hydrodynamical simulations in the same field of view (solid lines). Error bars represent the error on the mean computed with 100 bootstrap samplings (in most cases smaller than the dot size). Open circles indicate the values of the measured SFs without the statistical error subtraction (see Eqs. (17) and (18)). The FOV covers only a small fraction of the cluster, namely the core region.
Current usage metrics show cumulative count of Article Views (full-text article views including HTML views, PDF and ePub downloads, according to the available data) and Abstracts Views on Vision4Press platform.
Data correspond to usage on the plateform after 2015. The current usage metrics is available 48-96 hours after online publication and is updated daily on week days.
Initial download of the metrics may take a while.