Fig. 3.
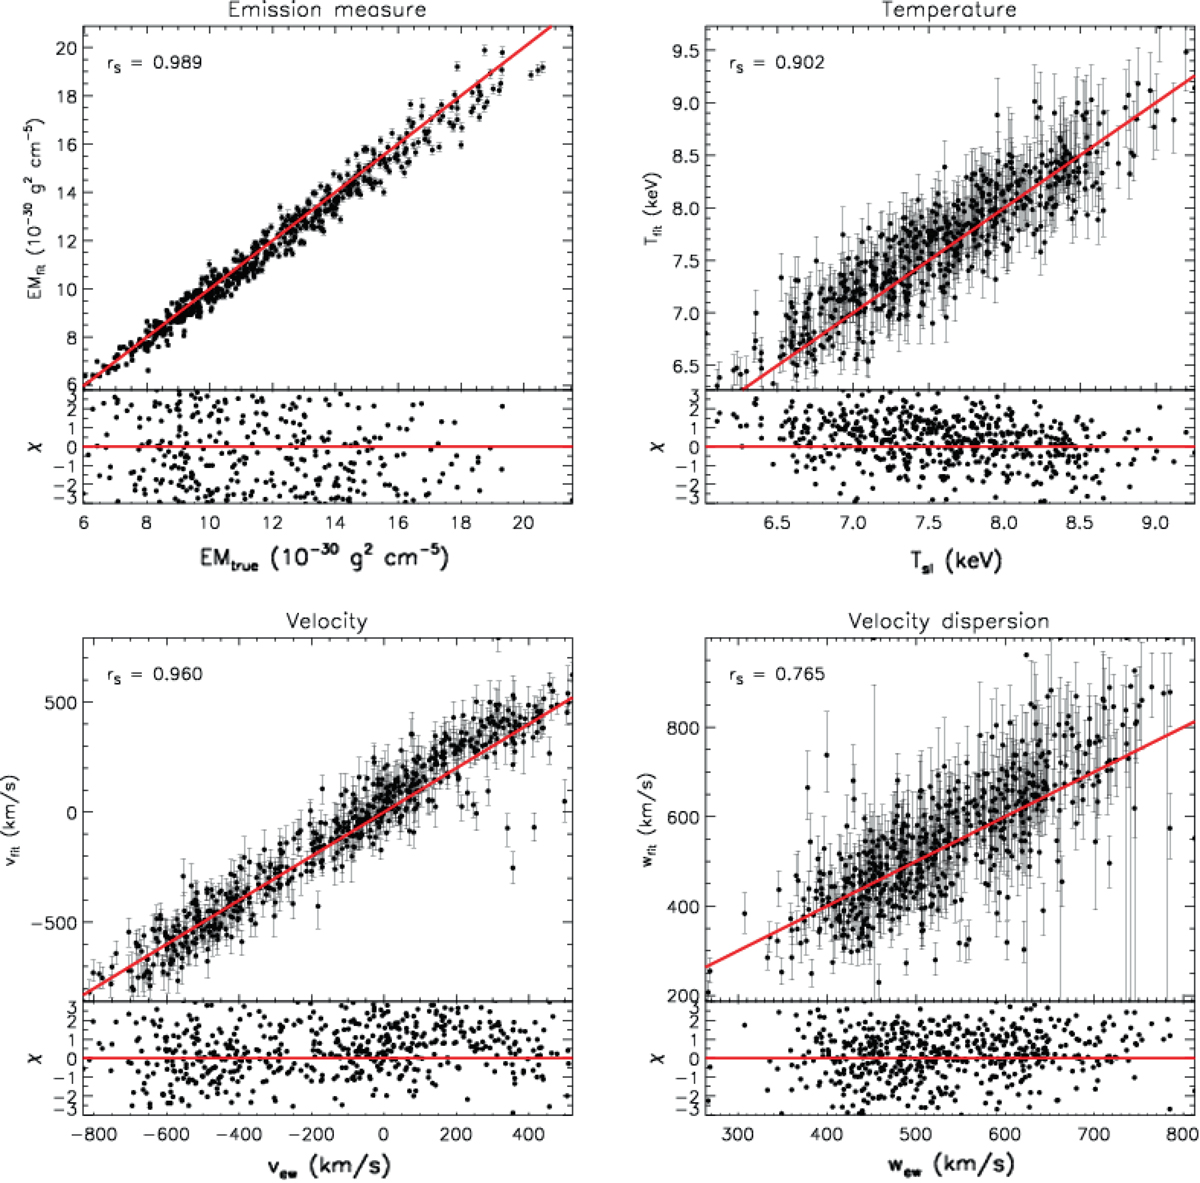
Scatter plots of observed quantities with errors (y-axis) vs. input projected values (x-axis) for the ℳ = 0.75 simulation. Top left: emission measure. Top right: temperature vs. spectroscopic-like temperature. Bottom left: velocity vs. emission-weighted velocity. Bottom right: velocity dispersion vs. emission-weighted velocity dispersion. In each plot the red solid lines shows the identity and the bottom panel shows the residuals in units of σ. In the top left corner of each panel we show the Spearman correlation rank between observed and input values.
Current usage metrics show cumulative count of Article Views (full-text article views including HTML views, PDF and ePub downloads, according to the available data) and Abstracts Views on Vision4Press platform.
Data correspond to usage on the plateform after 2015. The current usage metrics is available 48-96 hours after online publication and is updated daily on week days.
Initial download of the metrics may take a while.