Fig. 2.
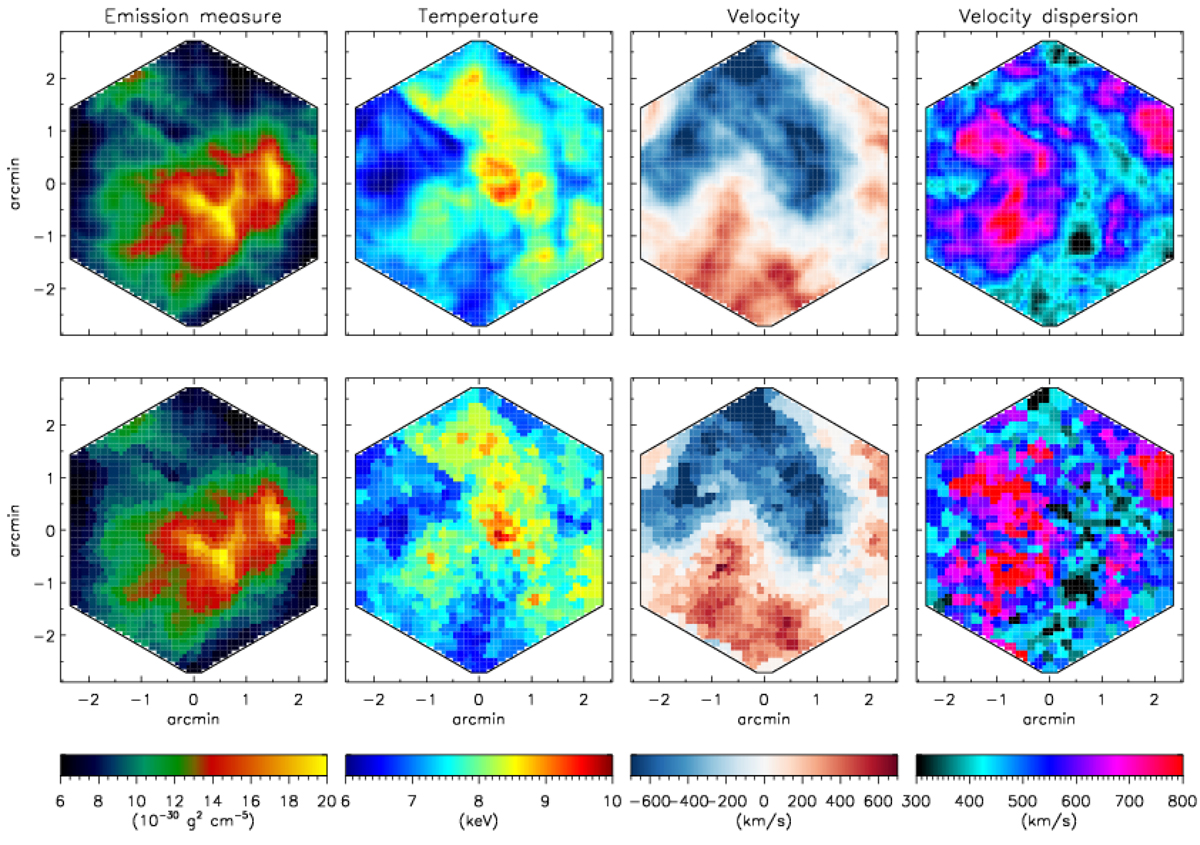
X-IFU maps showing input quantities (top panels) vs. measured ones (bottom) for the ℳ = 0.75 model. Input quantities are derived directly from the simulation output, considering the average along the line of sight enclosed by the X-IFU pixel (4.38 arcsec wide) and computed with the definitions in Eqs. (3)–(6). For measured quantities we show the nominal value derived from the fitting of our synthetic spectra (see text for details) in the corresponding 588 Voronoi regions (≈125 arcsec2 each). From left to right: emission measure, gas temperature (spectroscopic-like, in the top panel), velocity, and velocity dispersion (both emission-weighted, in the top panels).
Current usage metrics show cumulative count of Article Views (full-text article views including HTML views, PDF and ePub downloads, according to the available data) and Abstracts Views on Vision4Press platform.
Data correspond to usage on the plateform after 2015. The current usage metrics is available 48-96 hours after online publication and is updated daily on week days.
Initial download of the metrics may take a while.