Fig. 1.
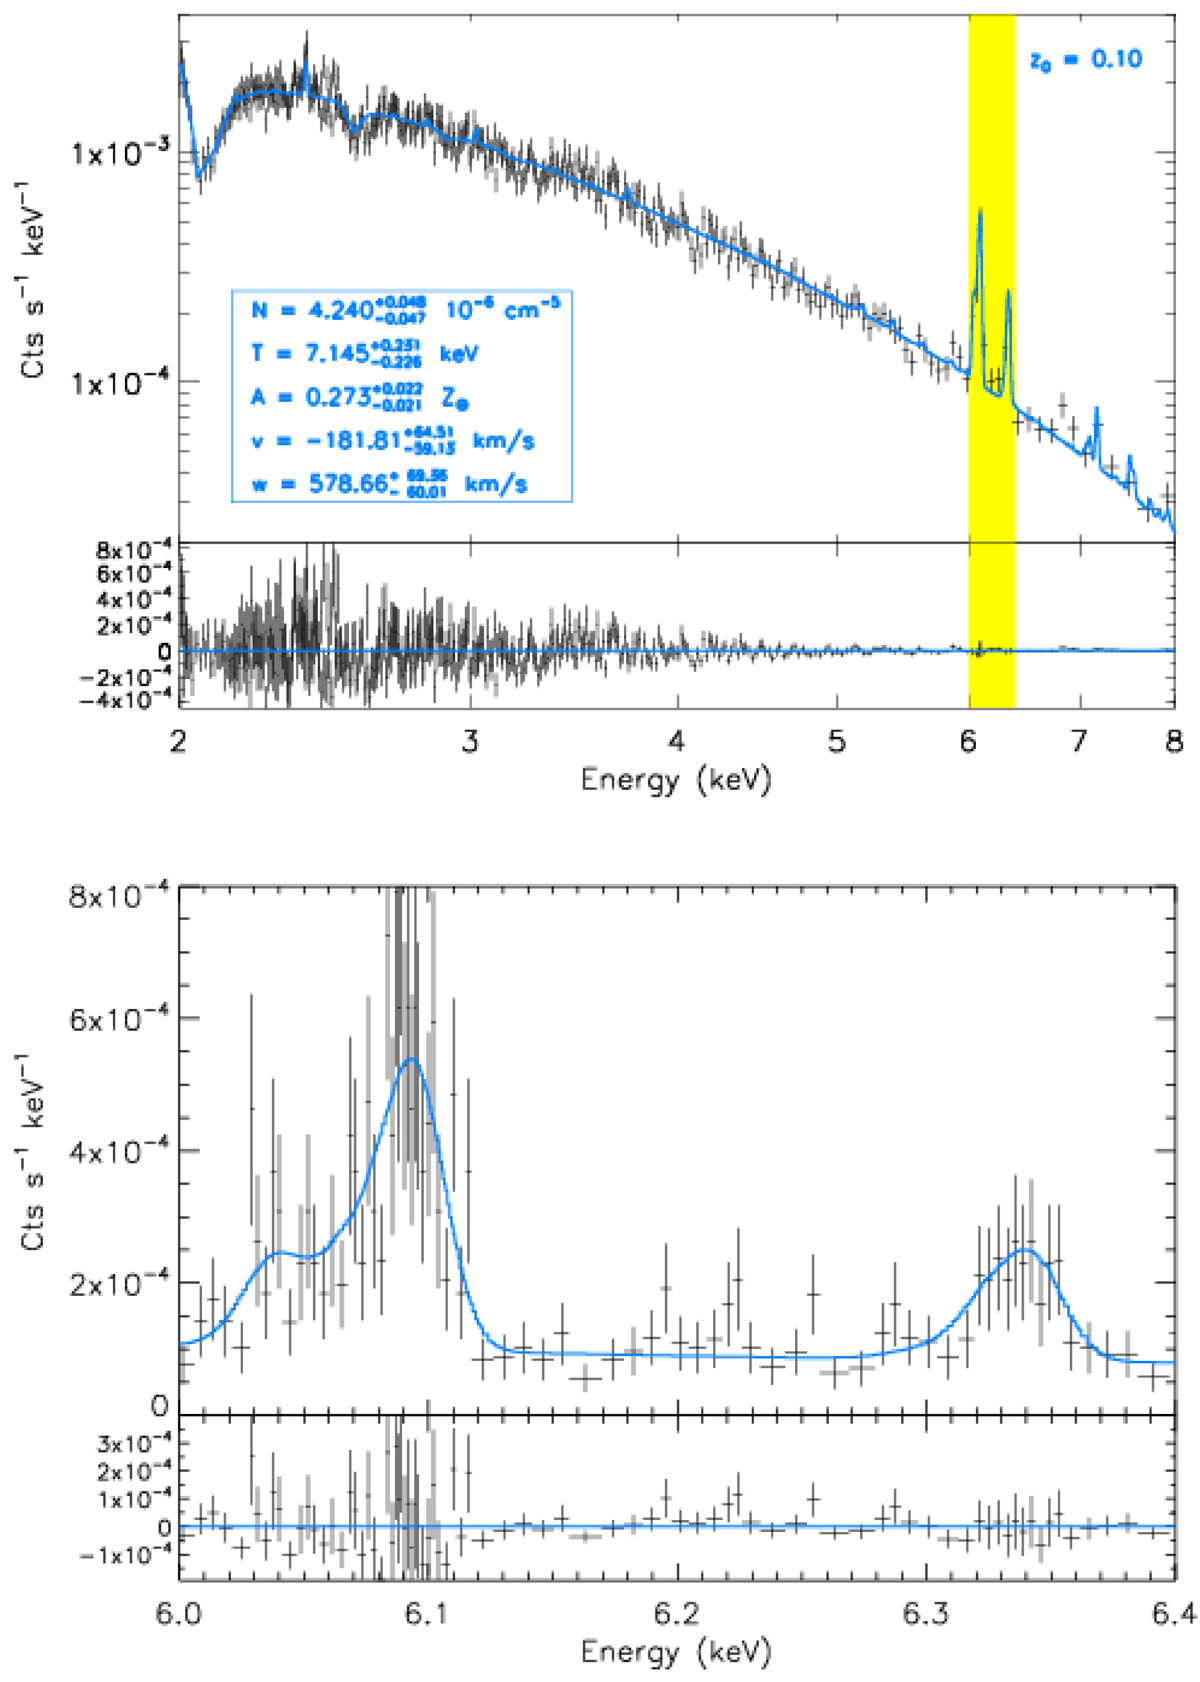
Example of a mock X-IFU spectrum extracted from the ℳ = 0.75 run and of its fitting procedure. Top panel: spectral data points with error bars (black crosses) in the whole fitting interval and best-fit model (blue line). Fit results, with errors, for the five free parameters are indicated in the box in the bottom left. The value of ν is obtained assuming the true redshift, z 0 = 0.1, is known. The bottom subpanel shows the residuals with respect to the model. Bottom panel: same as top panel, but zooming on the 6–6.4 keV energy range (highlighted in yellow in the top panel) where the most prominent emission lines are present. In this case the features correspond to the blending of the Fe XXV and Fe XXVI K complexes. In both panels data points have been rebinned for display purposes. The plot scaling for the spectra is logarithmic in the top panel and linear in the bottom panel.
Current usage metrics show cumulative count of Article Views (full-text article views including HTML views, PDF and ePub downloads, according to the available data) and Abstracts Views on Vision4Press platform.
Data correspond to usage on the plateform after 2015. The current usage metrics is available 48-96 hours after online publication and is updated daily on week days.
Initial download of the metrics may take a while.