Fig. C.1.
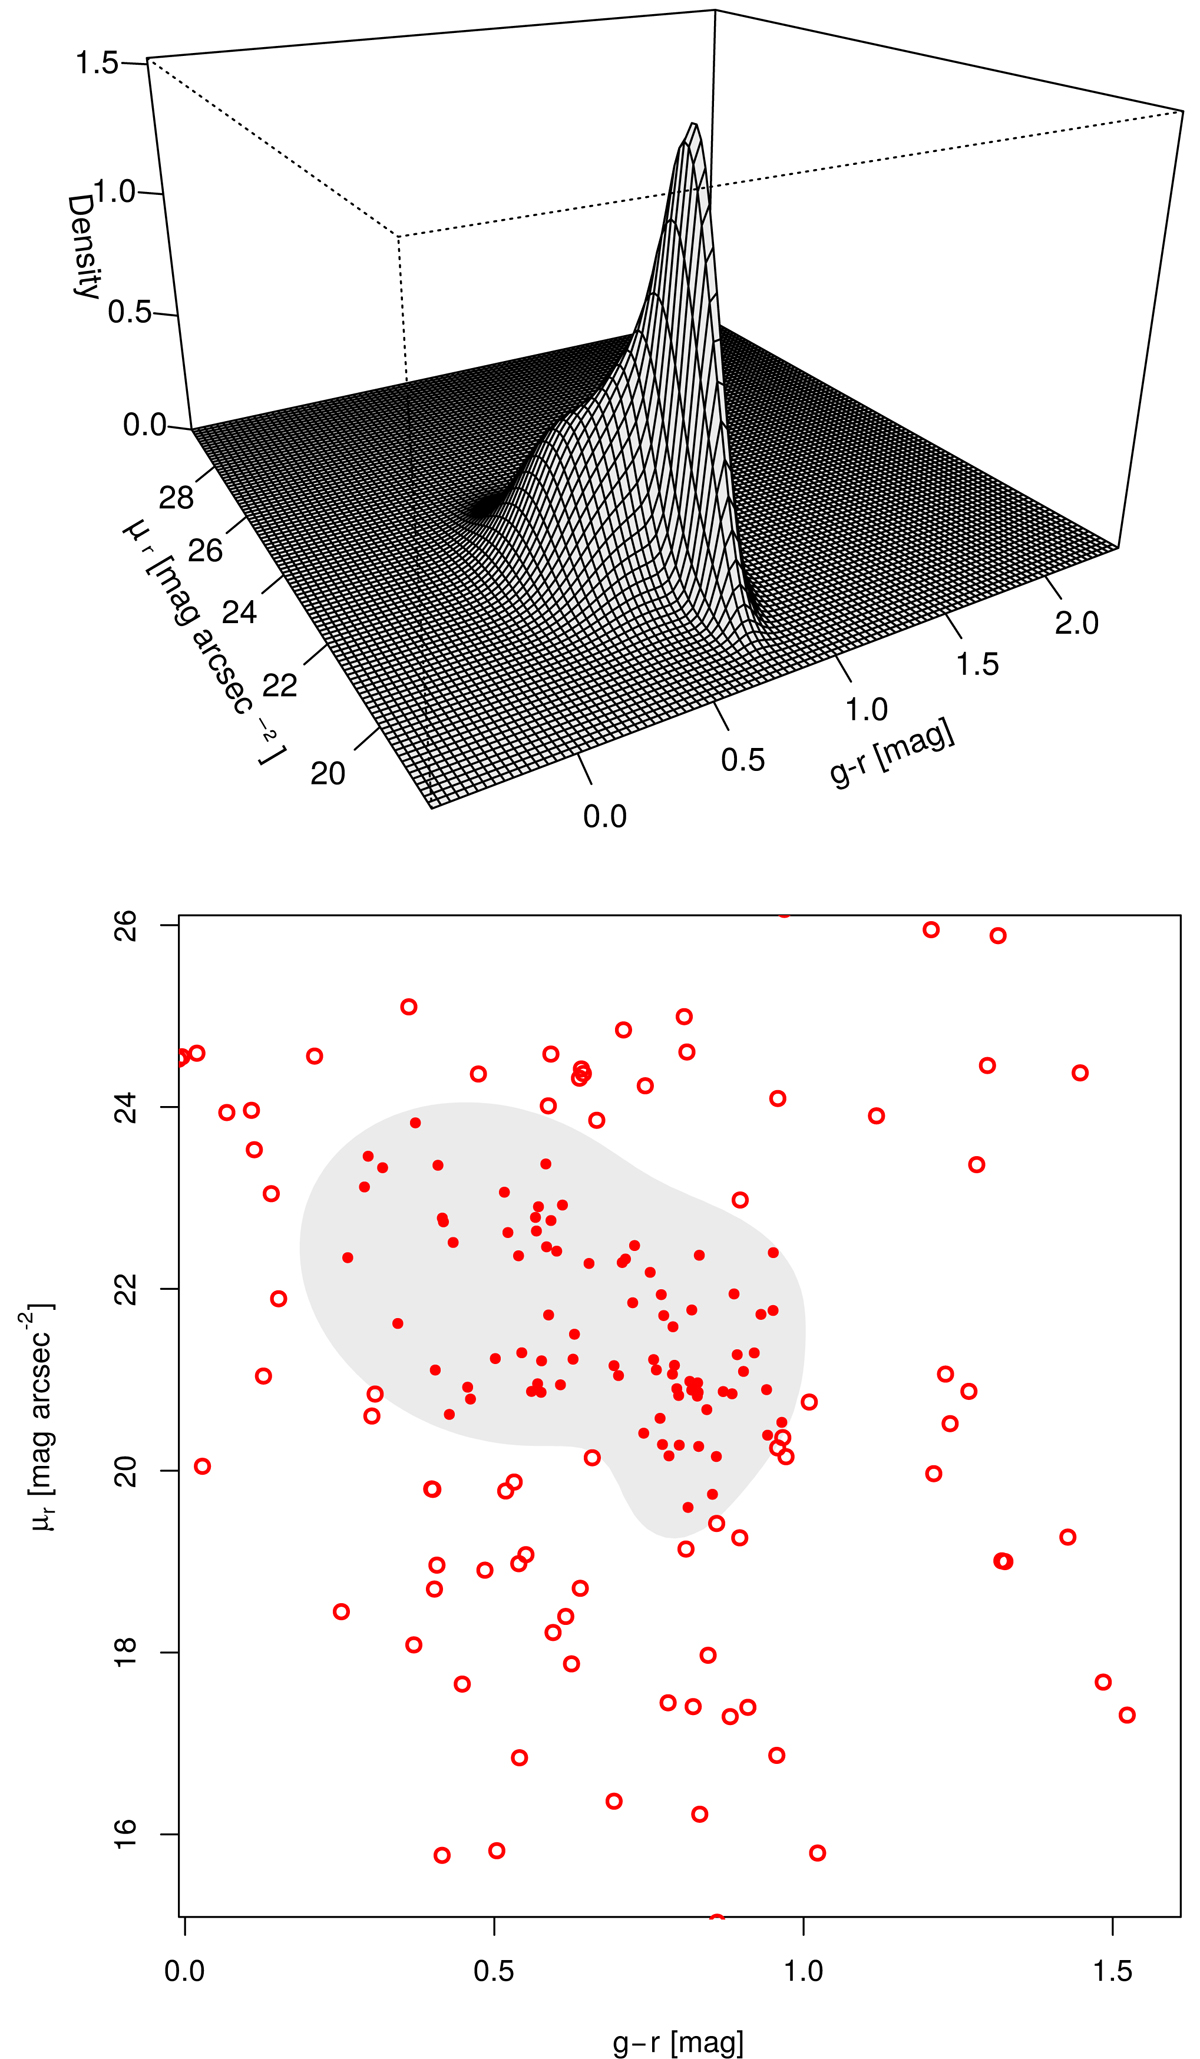
Upper plot: perspective plot of the bivariate density estimate in the surface brightness vs colour plane for the spectroscopic galaxies in the SDSS DR14 that are in the same redshift and magnitude ranges as those HMCGs that contain potentially contaminating photometric galaxies. Lower plot: grey area encloses 95% of the spectroscopic galaxies. Red filled dots are photometric galaxies in the same magnitude range of their host CGs, and that are considered potential sources of contamination (inside the grey region), while red open dots are galaxies classified as non-contaminating objects (outside the grey region)(see text for details).
Current usage metrics show cumulative count of Article Views (full-text article views including HTML views, PDF and ePub downloads, according to the available data) and Abstracts Views on Vision4Press platform.
Data correspond to usage on the plateform after 2015. The current usage metrics is available 48-96 hours after online publication and is updated daily on week days.
Initial download of the metrics may take a while.