Fig. 5.
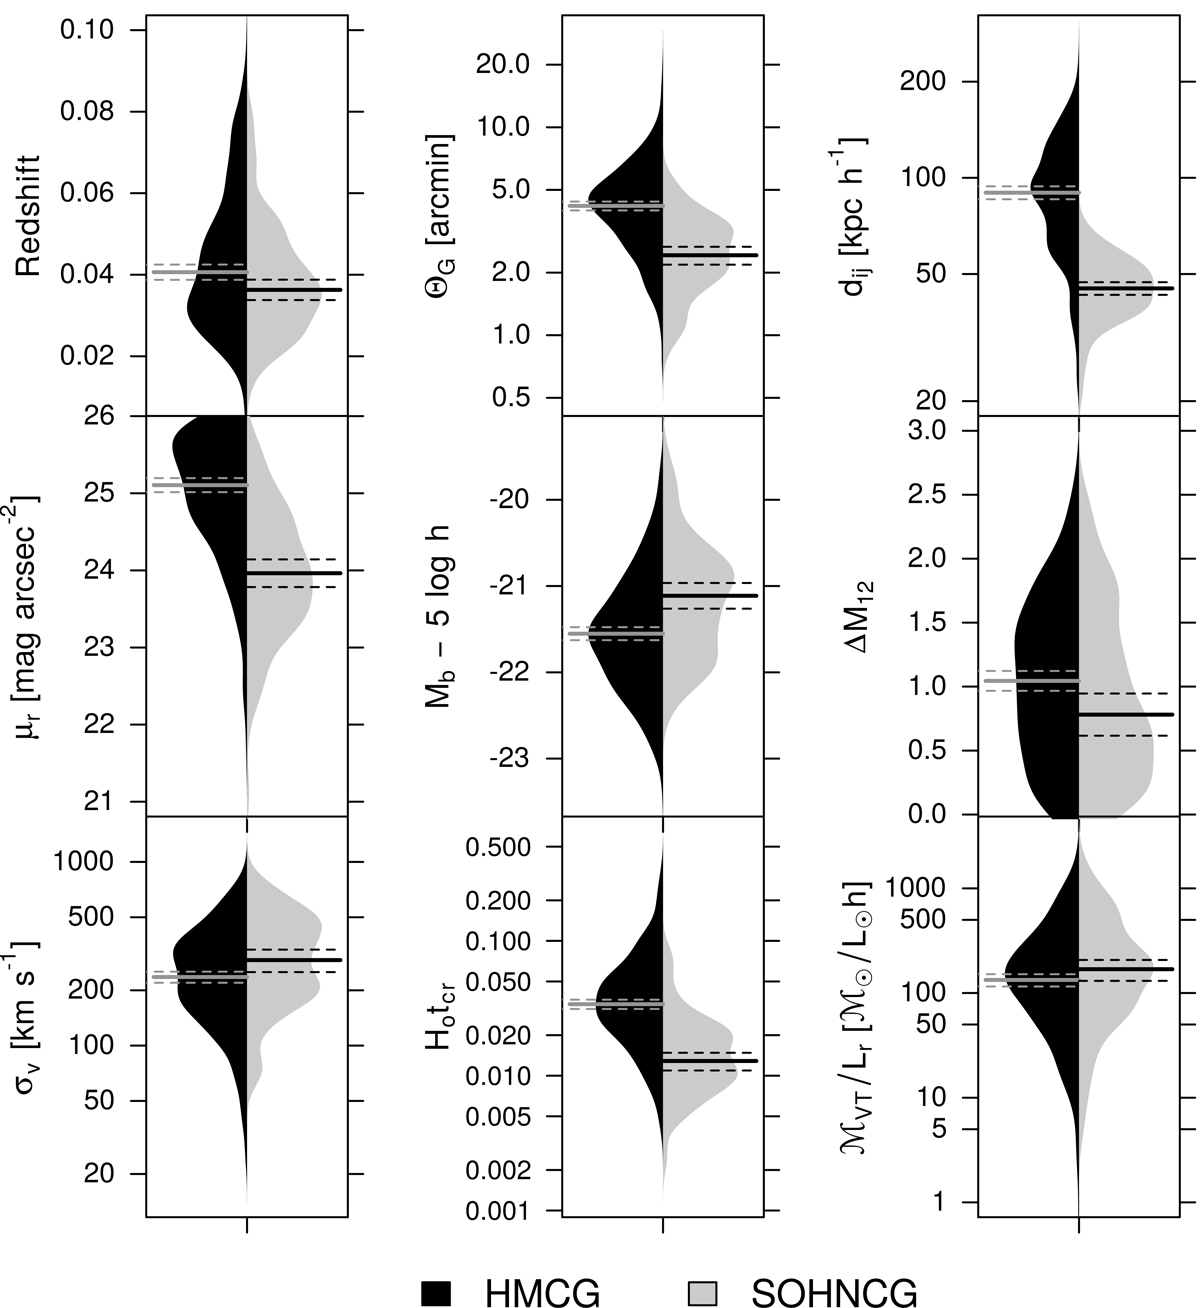
Comparison of CG properties using asymmetric beanplots (Kampstra 2008). The black beans represent the density distributions for CGs identified with the modified algorithm (HMCGs), while grey distributions corresponds to the CGs that belong to the SOHNCGs sample. Both samples were restricted to perform a fair comparison (see text for details). Horizontal solid lines show the median values for each property distribution, while the horizontal dashed lines show the upper and lower limits of their corresponding 95% confidence intervals (Krzywinski & Altman 2014). This figure was made with R software (R Core Team 2013).
Current usage metrics show cumulative count of Article Views (full-text article views including HTML views, PDF and ePub downloads, according to the available data) and Abstracts Views on Vision4Press platform.
Data correspond to usage on the plateform after 2015. The current usage metrics is available 48-96 hours after online publication and is updated daily on week days.
Initial download of the metrics may take a while.