Fig. 2.
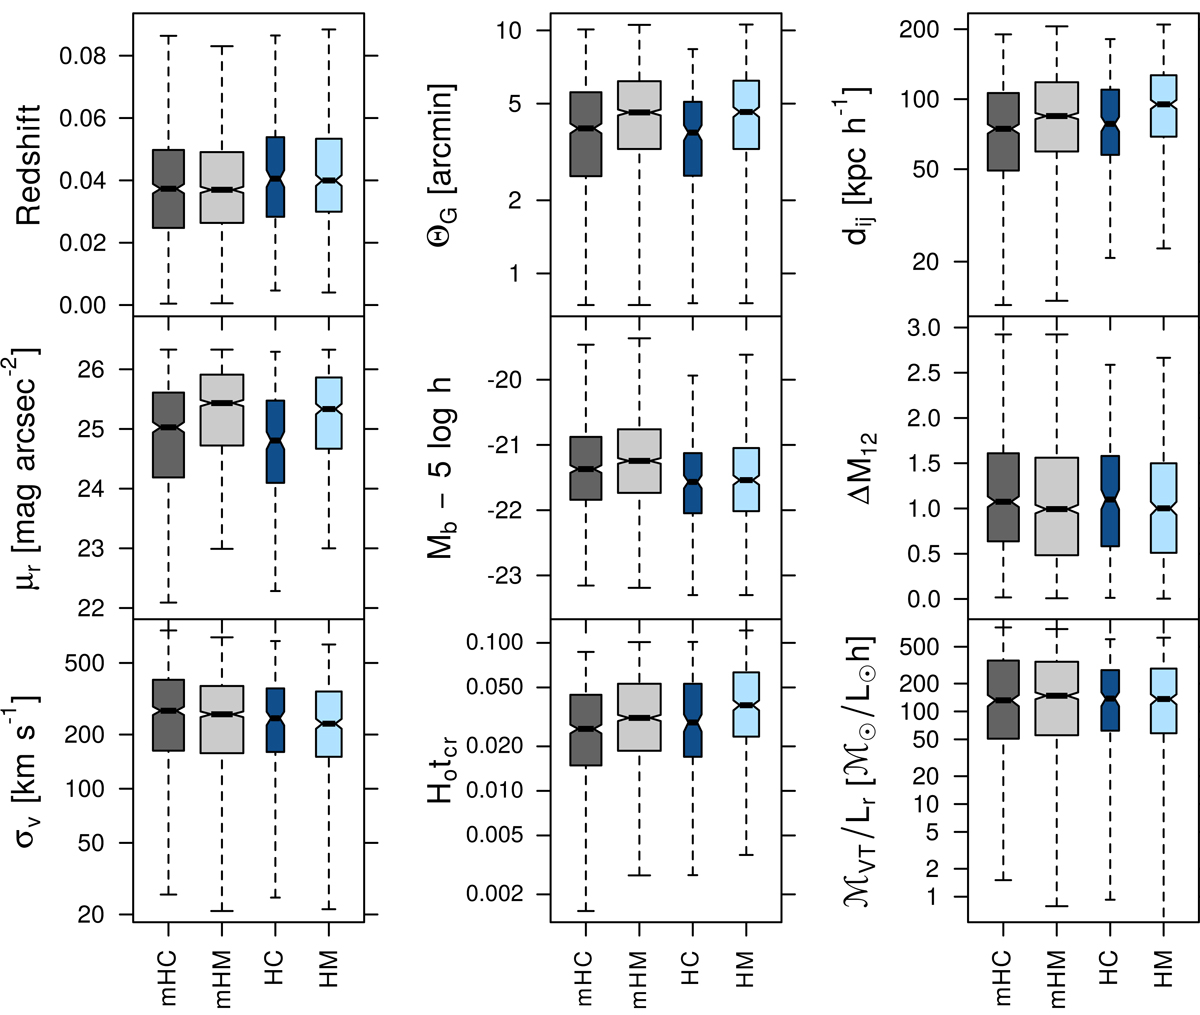
Boxplot diagrams of CG properties for groups identified using the classic and the modified algorithm. The notches (waists) in the boxes indicate ∼95 % confidence intervals for the medians, while the widths are proportional to the square roots of the number of objects in each sample (R Core Team 2013). The boxplot diagrams on the left side in each panel are the samples obtained using the classic and the modified algorithms in the mock catalogue (mHC and mHM), while those at the right side show the results for the samples obtained applying both algorithms on the SDSS catalogue (HC and HM).
Current usage metrics show cumulative count of Article Views (full-text article views including HTML views, PDF and ePub downloads, according to the available data) and Abstracts Views on Vision4Press platform.
Data correspond to usage on the plateform after 2015. The current usage metrics is available 48-96 hours after online publication and is updated daily on week days.
Initial download of the metrics may take a while.