Free Access
Fig. 6.
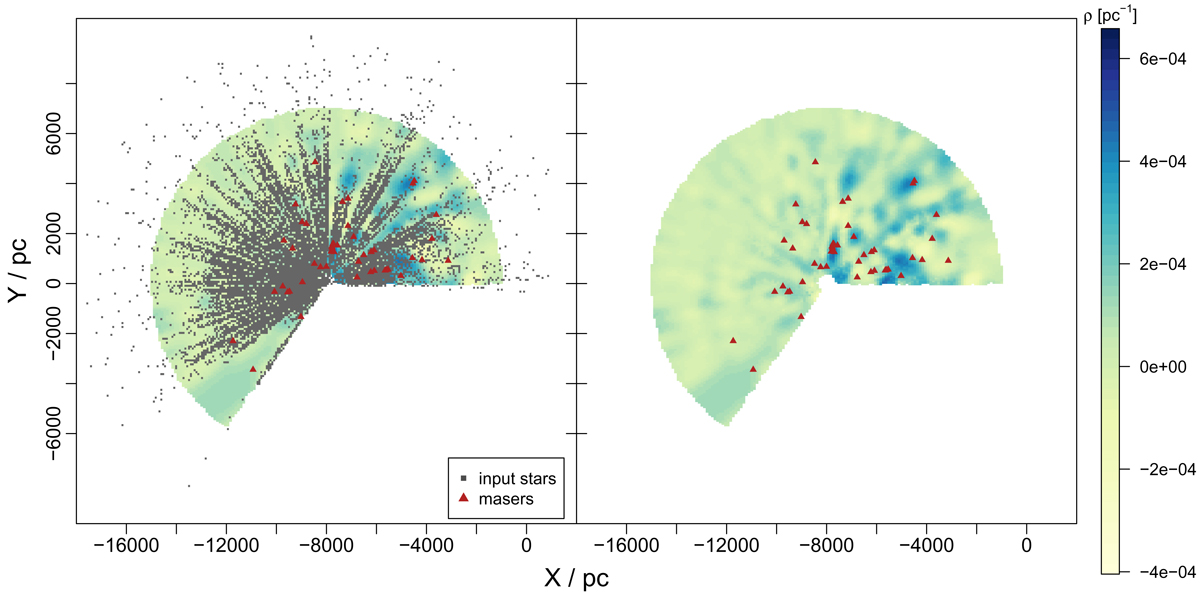
The left panel is the same as the left panel of Fig. 3, but now overplotting as triangles the positions of masers from Reid et al. (2014) which are within ±100 pc of the disk midplane. Some of the masers show correlation with high density predictions. The right panel is the same, but with the stars removed.
Current usage metrics show cumulative count of Article Views (full-text article views including HTML views, PDF and ePub downloads, according to the available data) and Abstracts Views on Vision4Press platform.
Data correspond to usage on the plateform after 2015. The current usage metrics is available 48-96 hours after online publication and is updated daily on week days.
Initial download of the metrics may take a while.