Fig. 4.
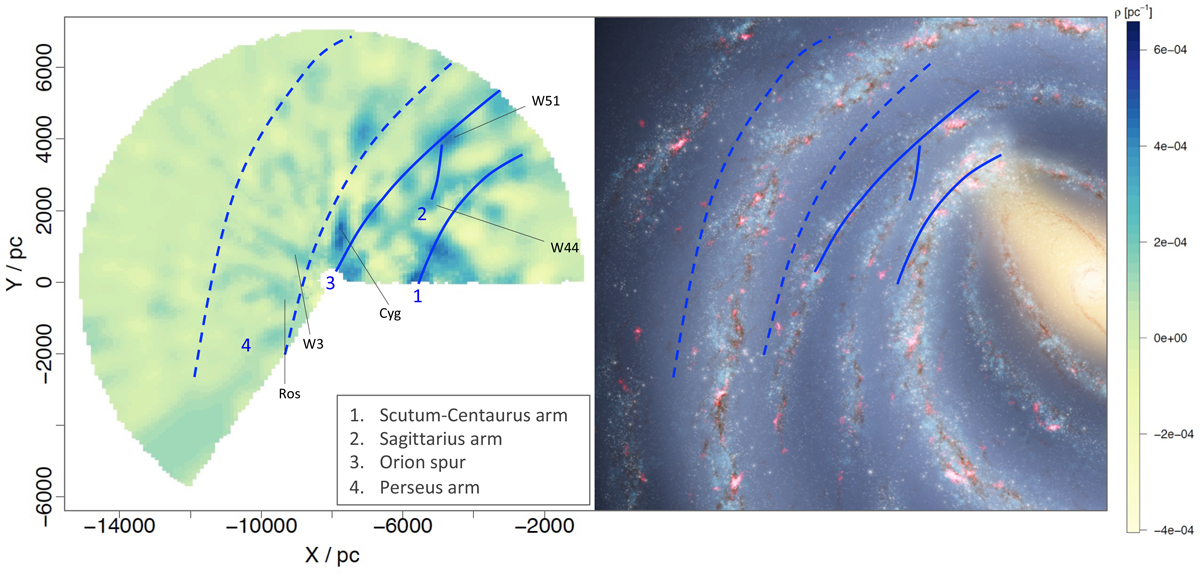
Left panel: our dust density predictions as in Fig. 2 (left panel), but now over-plotting with blue lines the approximate locations of the arms as we deduce them from this dust map. The dashed lines show an area in which relatively high density dust clouds are seen, but which do not lead to as such a distinct pattern as seen for the other three lines. The known giant molecular clouds detected in the map are also labelled. Right panel: our estimated location of the arms (blue lines) from the left panel plotted on top of the Spitzer sketch of the Galactic arms (by Robert Hurt, courtesy of NASA/JPL-Caltech/ESO).
Current usage metrics show cumulative count of Article Views (full-text article views including HTML views, PDF and ePub downloads, according to the available data) and Abstracts Views on Vision4Press platform.
Data correspond to usage on the plateform after 2015. The current usage metrics is available 48-96 hours after online publication and is updated daily on week days.
Initial download of the metrics may take a while.