Fig. 1.
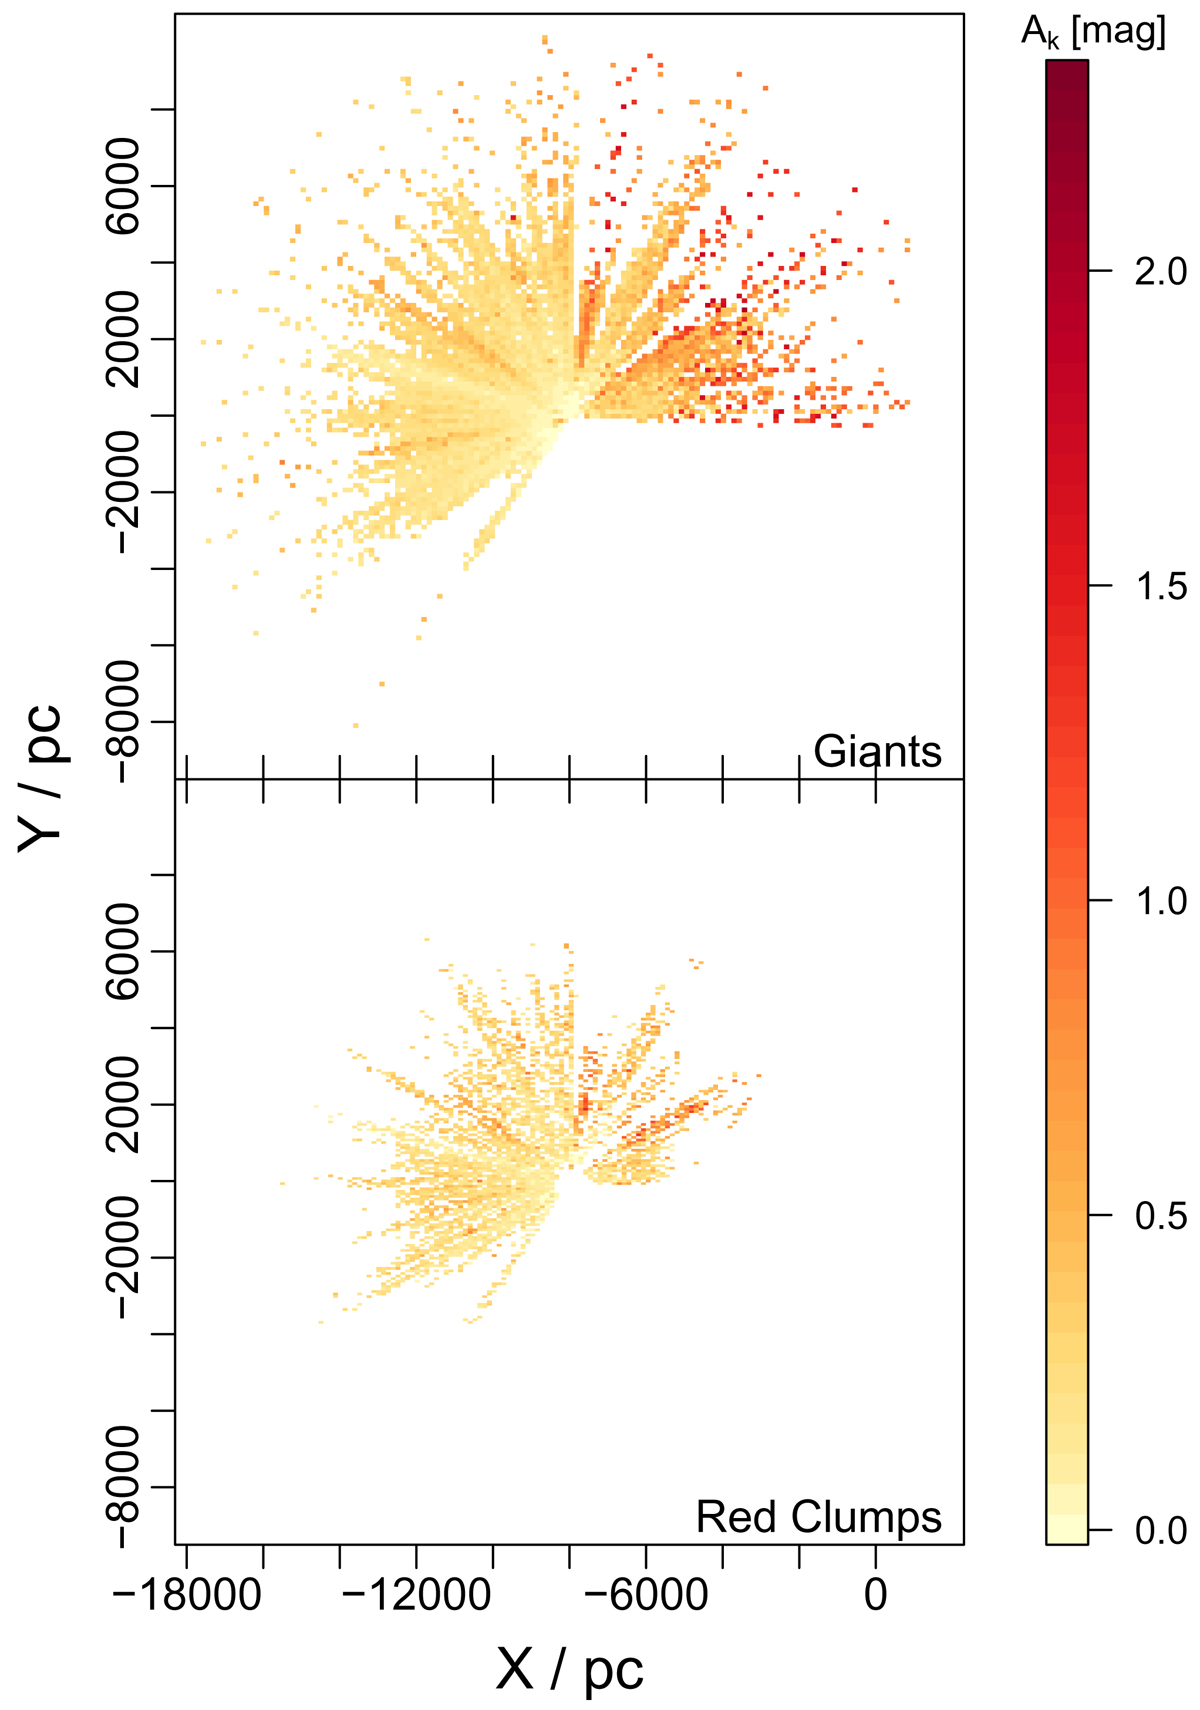
Distribution of input stars in the X–Y plane (±100 pc in Z). The sun is at (–8000, 0) and the Galactic centre is at (0,0). Top panel: giant stars and the bottom panel shows red clump stars. The colour represents their l.o.s. K-band extinction. Most giants can probe out to about 7 kpc, while red clump stars probe to about 5 kpc on average.
Current usage metrics show cumulative count of Article Views (full-text article views including HTML views, PDF and ePub downloads, according to the available data) and Abstracts Views on Vision4Press platform.
Data correspond to usage on the plateform after 2015. The current usage metrics is available 48-96 hours after online publication and is updated daily on week days.
Initial download of the metrics may take a while.