Free Access
Fig. 8.
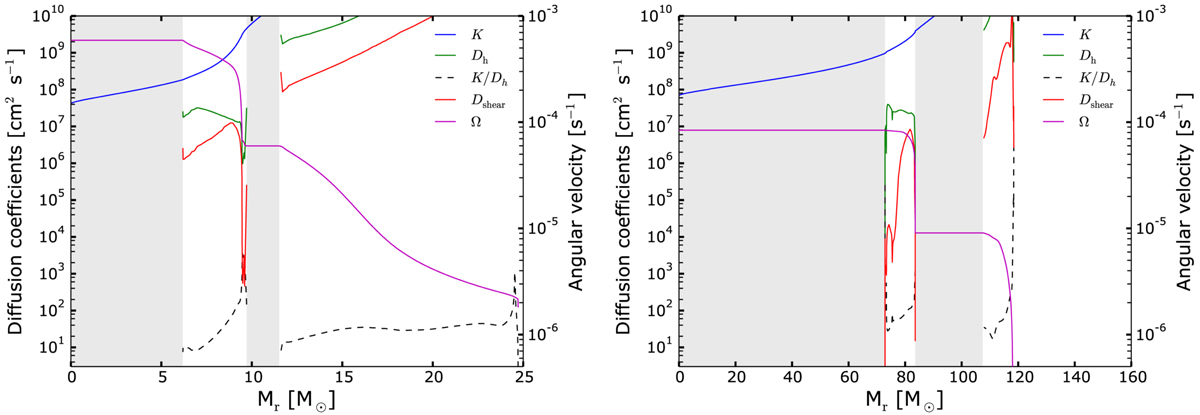
Internal Ω profile, Dshear coefficient, and other diffusion coefficients in Eq. (2) for the rotating 25 (left panel) and 150 M⊙ models (right panel) during the core He-burning phase (Yc = 0.66). Grey areas represent the convective zones and the dashed lines show the K/Dh ratio.
Current usage metrics show cumulative count of Article Views (full-text article views including HTML views, PDF and ePub downloads, according to the available data) and Abstracts Views on Vision4Press platform.
Data correspond to usage on the plateform after 2015. The current usage metrics is available 48-96 hours after online publication and is updated daily on week days.
Initial download of the metrics may take a while.