Fig. 7.
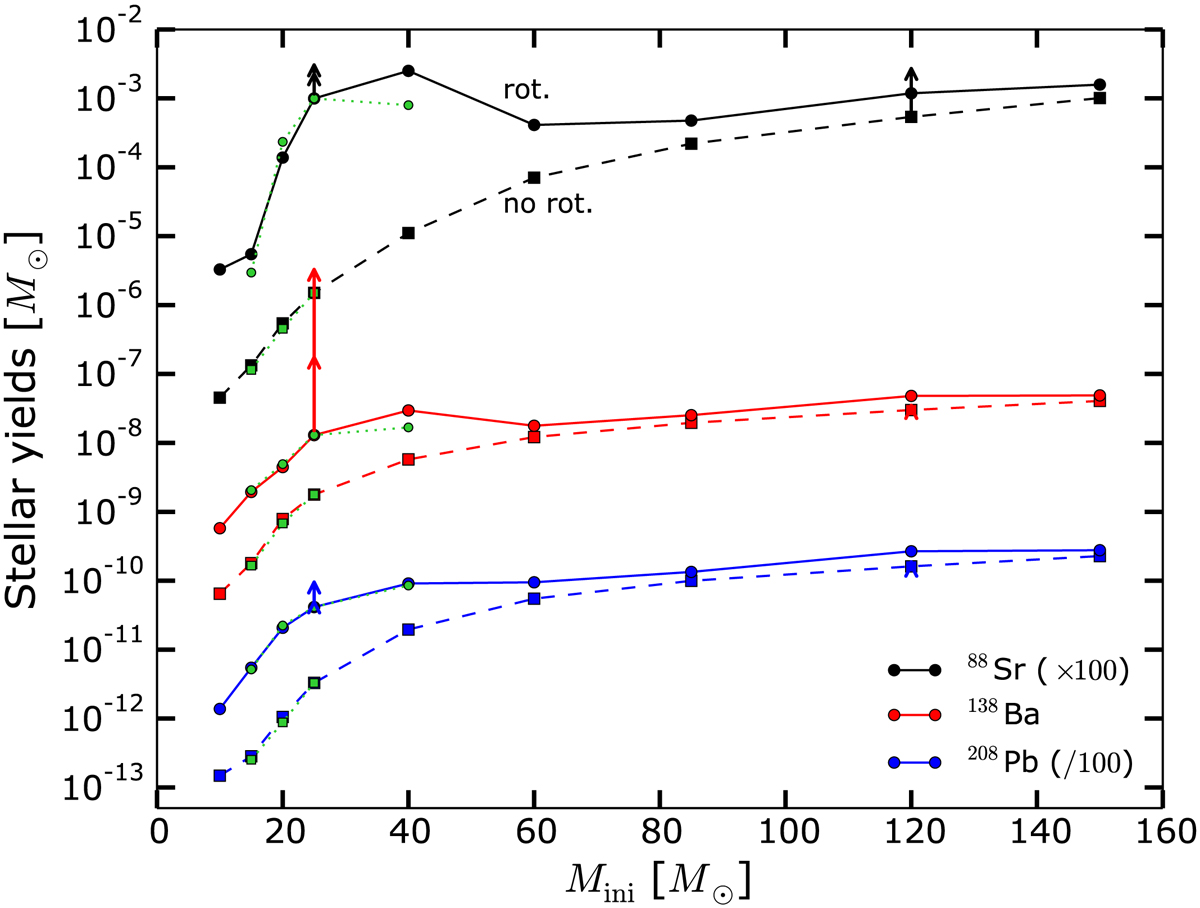
Stellar yields in M⊙ (Eq. (3)) as a function of the initial mass Mini for the non-rotating (dashed lines) and rotating (solid lines) models. The mass cut is set using the relation of Maeder (1992). Isotopes 88Sr, 138Ba, and 208Pb are shown. Green patterns between 15 and 40 M⊙ are the yields of the F16 models. The small and big red arrows at Mini = 25 M⊙ indicate the yields of 138Ba for the fast-rotating 25 M⊙ model and the fast-rotating 25 M⊙ models with a lower 17O(α, γ) rate respectively. The same arrows are plotted for 88Sr and 208Pb. Arrows at Mini = 120 M⊙ represent the 120 M⊙ model with a lower 17O(α, γ) rate. We note that some arrows are not visible because there are too small.
Current usage metrics show cumulative count of Article Views (full-text article views including HTML views, PDF and ePub downloads, according to the available data) and Abstracts Views on Vision4Press platform.
Data correspond to usage on the plateform after 2015. The current usage metrics is available 48-96 hours after online publication and is updated daily on week days.
Initial download of the metrics may take a while.