Fig. 1.
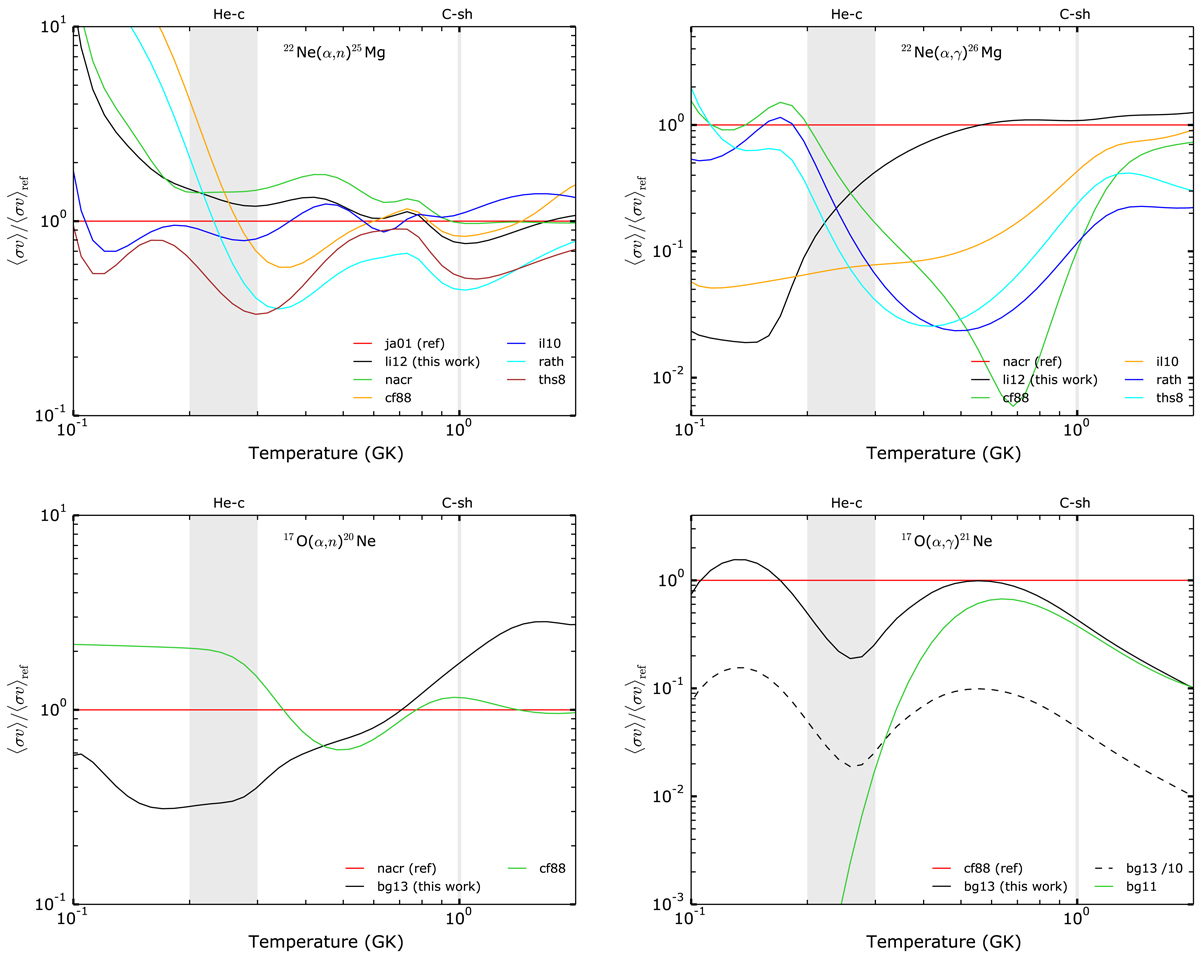
Comparison between different sources of the important reaction rates for the s-process in massive stars as a function of the temperature. “ja01”: Jaeger et al. (2001), “nacr”: Angulo et al. (1999), “li12”: Longland et al. (2012), “cf88”: Caughlan & Fowler (1988), “il10”: Iliadis et al. (2010), “rath”: Rauscher & Thielemann (2000), “ths8”: Cyburt et al. (2010), “bg11”: Best et al. (2011), “bg13”: Best et al. (2013). We note that the Best et al. (2011) rate is an experimental lower limit. The shaded bands indicate the approximate ranges of temperature of interest for the s-process in massive stars: the first area named “He–c” is associated to the s-process during the core helium burning phase and the second area (“C–sh”) during carbon shell burning.
Current usage metrics show cumulative count of Article Views (full-text article views including HTML views, PDF and ePub downloads, according to the available data) and Abstracts Views on Vision4Press platform.
Data correspond to usage on the plateform after 2015. The current usage metrics is available 48-96 hours after online publication and is updated daily on week days.
Initial download of the metrics may take a while.