Fig. 8.
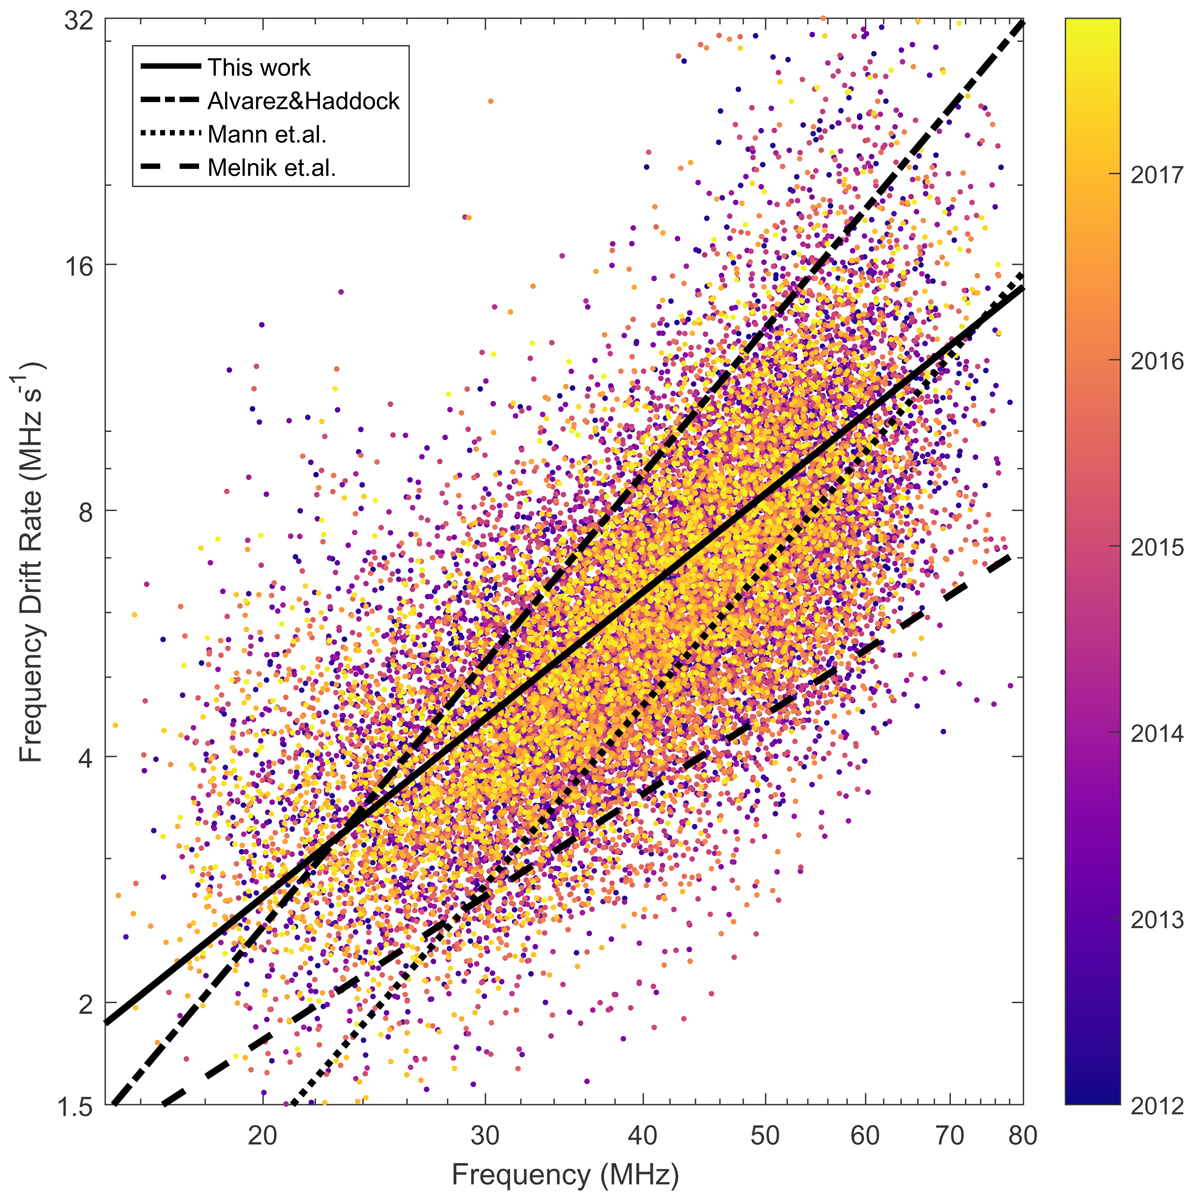
Scatter plot of the frequency drift rate vs frequency for 1389 simple type III bursts; the data points are color-coded according to the occurrence time of the corresponding event. The solid line indicate the least-squares fitting result df/dt = 0.0672 f1.23 in this work. The dot-dashed, dotted, and dashed lines stand for the results in the literature obtained by Alvarez & Haddock (1973a), Mann et al. (1999), and Melnik et al. (2011), respectively.
Current usage metrics show cumulative count of Article Views (full-text article views including HTML views, PDF and ePub downloads, according to the available data) and Abstracts Views on Vision4Press platform.
Data correspond to usage on the plateform after 2015. The current usage metrics is available 48-96 hours after online publication and is updated daily on week days.
Initial download of the metrics may take a while.