Free Access
Fig. 7.
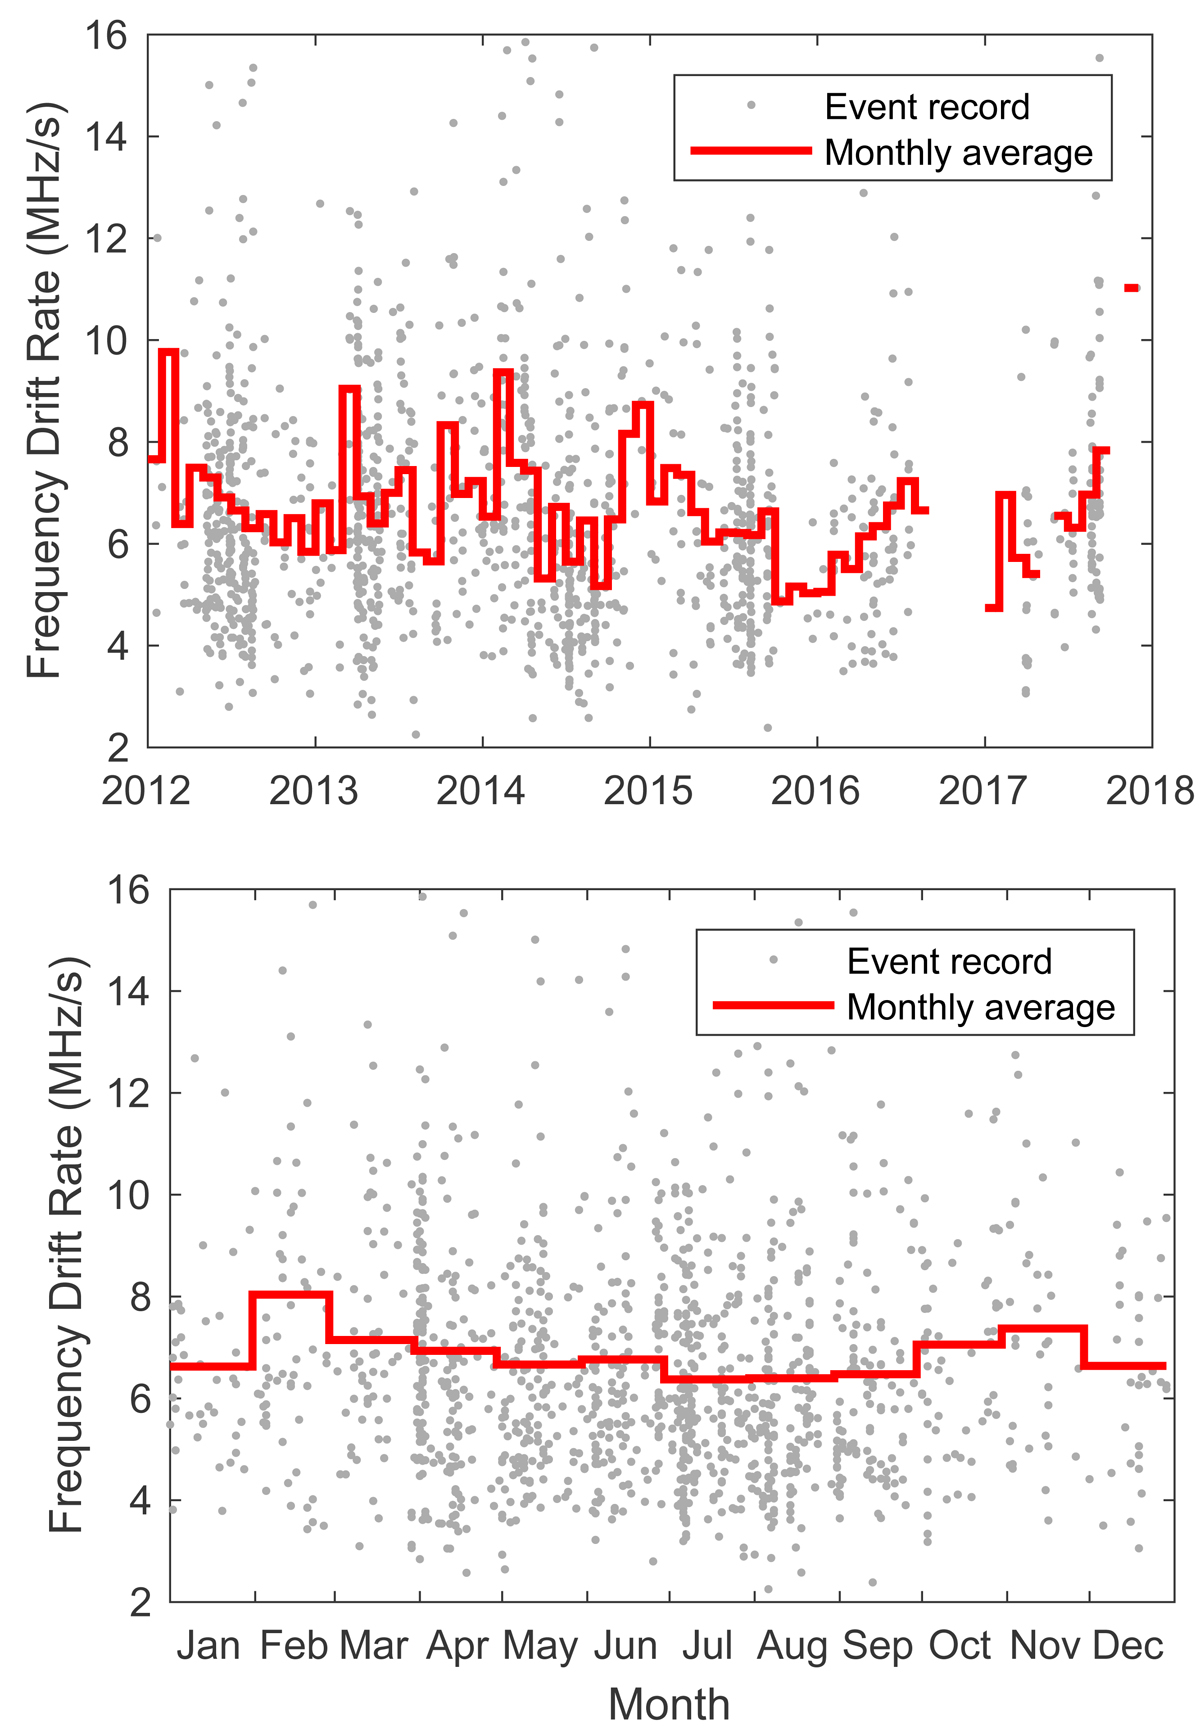
Scatter plots and temporal variation of the frequency drift rate; each gray point represents the estimated average drift rate of a type III burst. The red lines in the top and bottom panels indicate the monthly average value in different years and the monthly accumulated average value of all years, respectively.
Current usage metrics show cumulative count of Article Views (full-text article views including HTML views, PDF and ePub downloads, according to the available data) and Abstracts Views on Vision4Press platform.
Data correspond to usage on the plateform after 2015. The current usage metrics is available 48-96 hours after online publication and is updated daily on week days.
Initial download of the metrics may take a while.