Fig. 5.
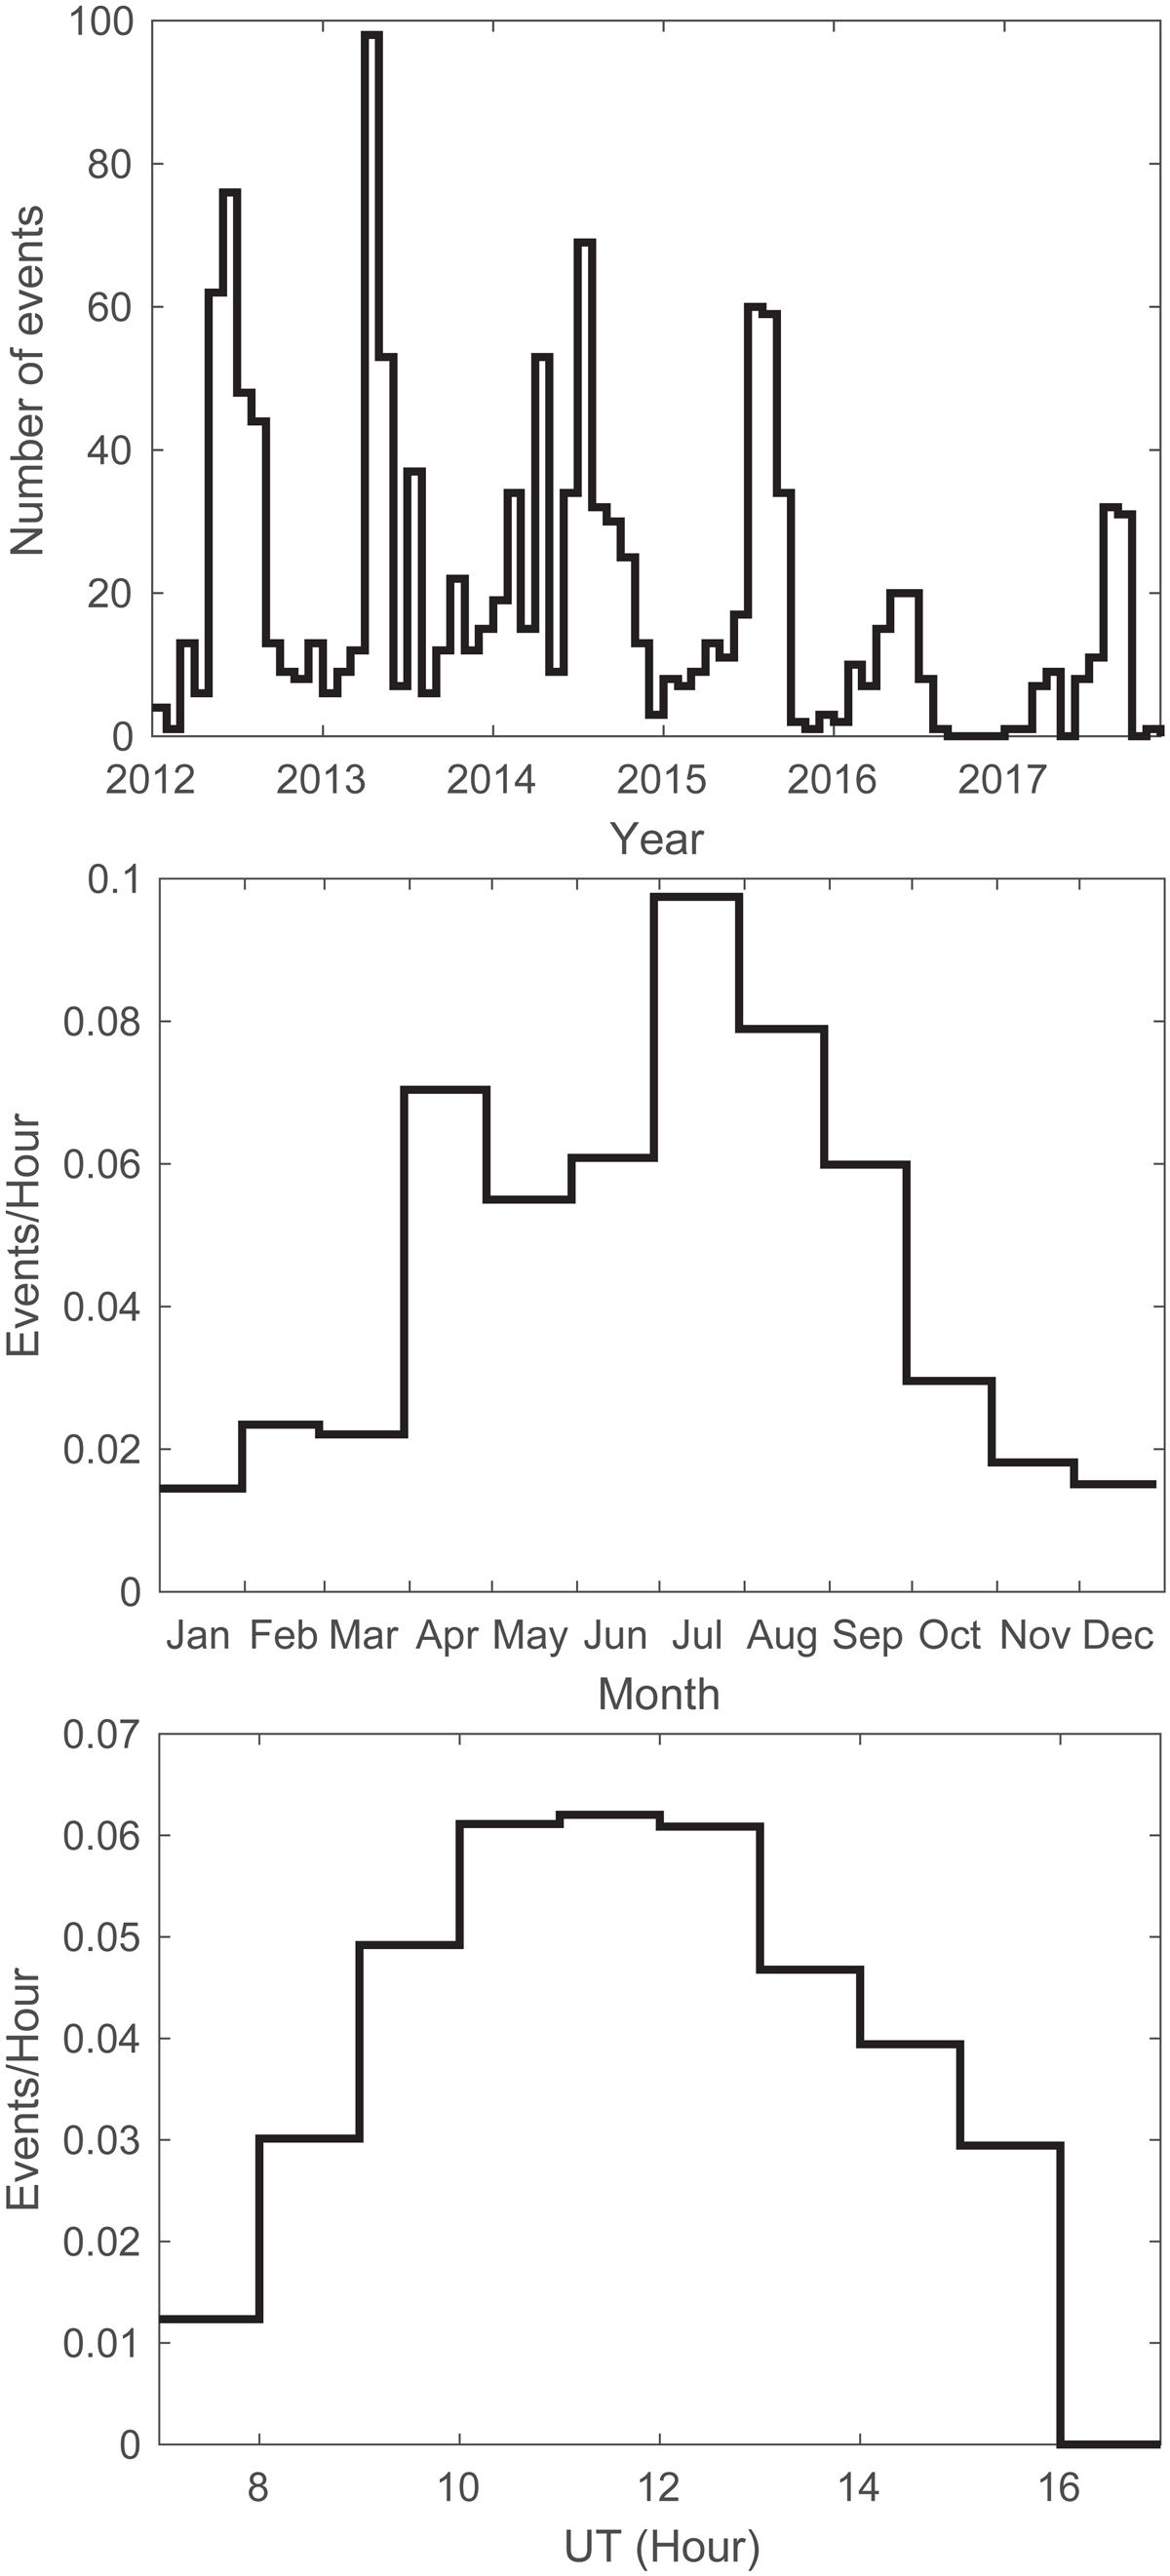
Histograms of the number of events in every month in different years (top panel), the monthly accumulated event occurrence rate (middle panel), and the hourly accumulated event occurrence rate (bottom panel) for 1389 simple well-isolated events. The occurrence rates are normalized to observation time by dividing the number of events by the total observing hours.
Current usage metrics show cumulative count of Article Views (full-text article views including HTML views, PDF and ePub downloads, according to the available data) and Abstracts Views on Vision4Press platform.
Data correspond to usage on the plateform after 2015. The current usage metrics is available 48-96 hours after online publication and is updated daily on week days.
Initial download of the metrics may take a while.