Fig. 1.
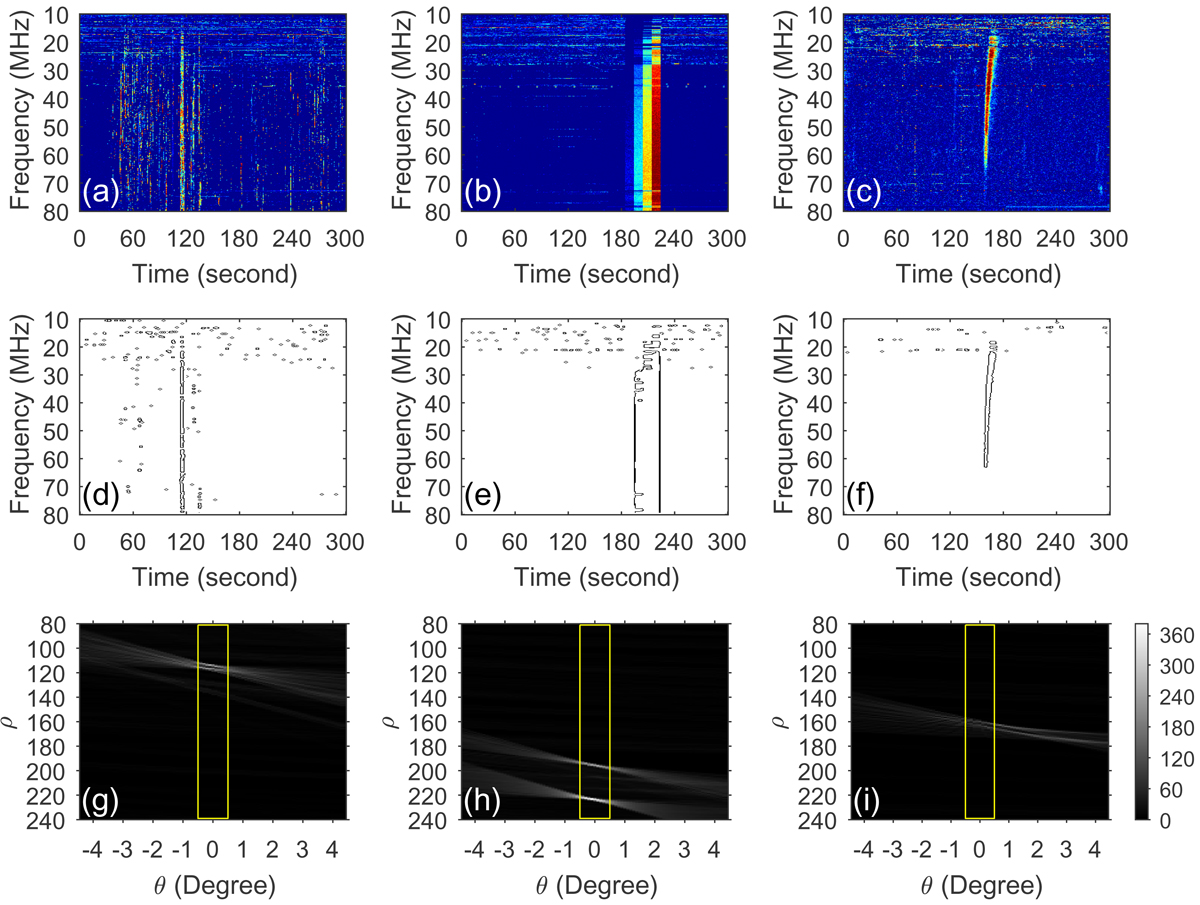
From top to bottom: dynamic spectra of two bad data segments and a type III event, their edge images detected using the Canny edge-detection method and the Hough transform results of the edge images. Left, middle, and right columns: results of a group of lightning discharges, a calibration bar, and a normal type III burst, respectively. The type III burst was observed on Apr 22, 2013, at 14:05UT.
Current usage metrics show cumulative count of Article Views (full-text article views including HTML views, PDF and ePub downloads, according to the available data) and Abstracts Views on Vision4Press platform.
Data correspond to usage on the plateform after 2015. The current usage metrics is available 48-96 hours after online publication and is updated daily on week days.
Initial download of the metrics may take a while.