Fig. 6.
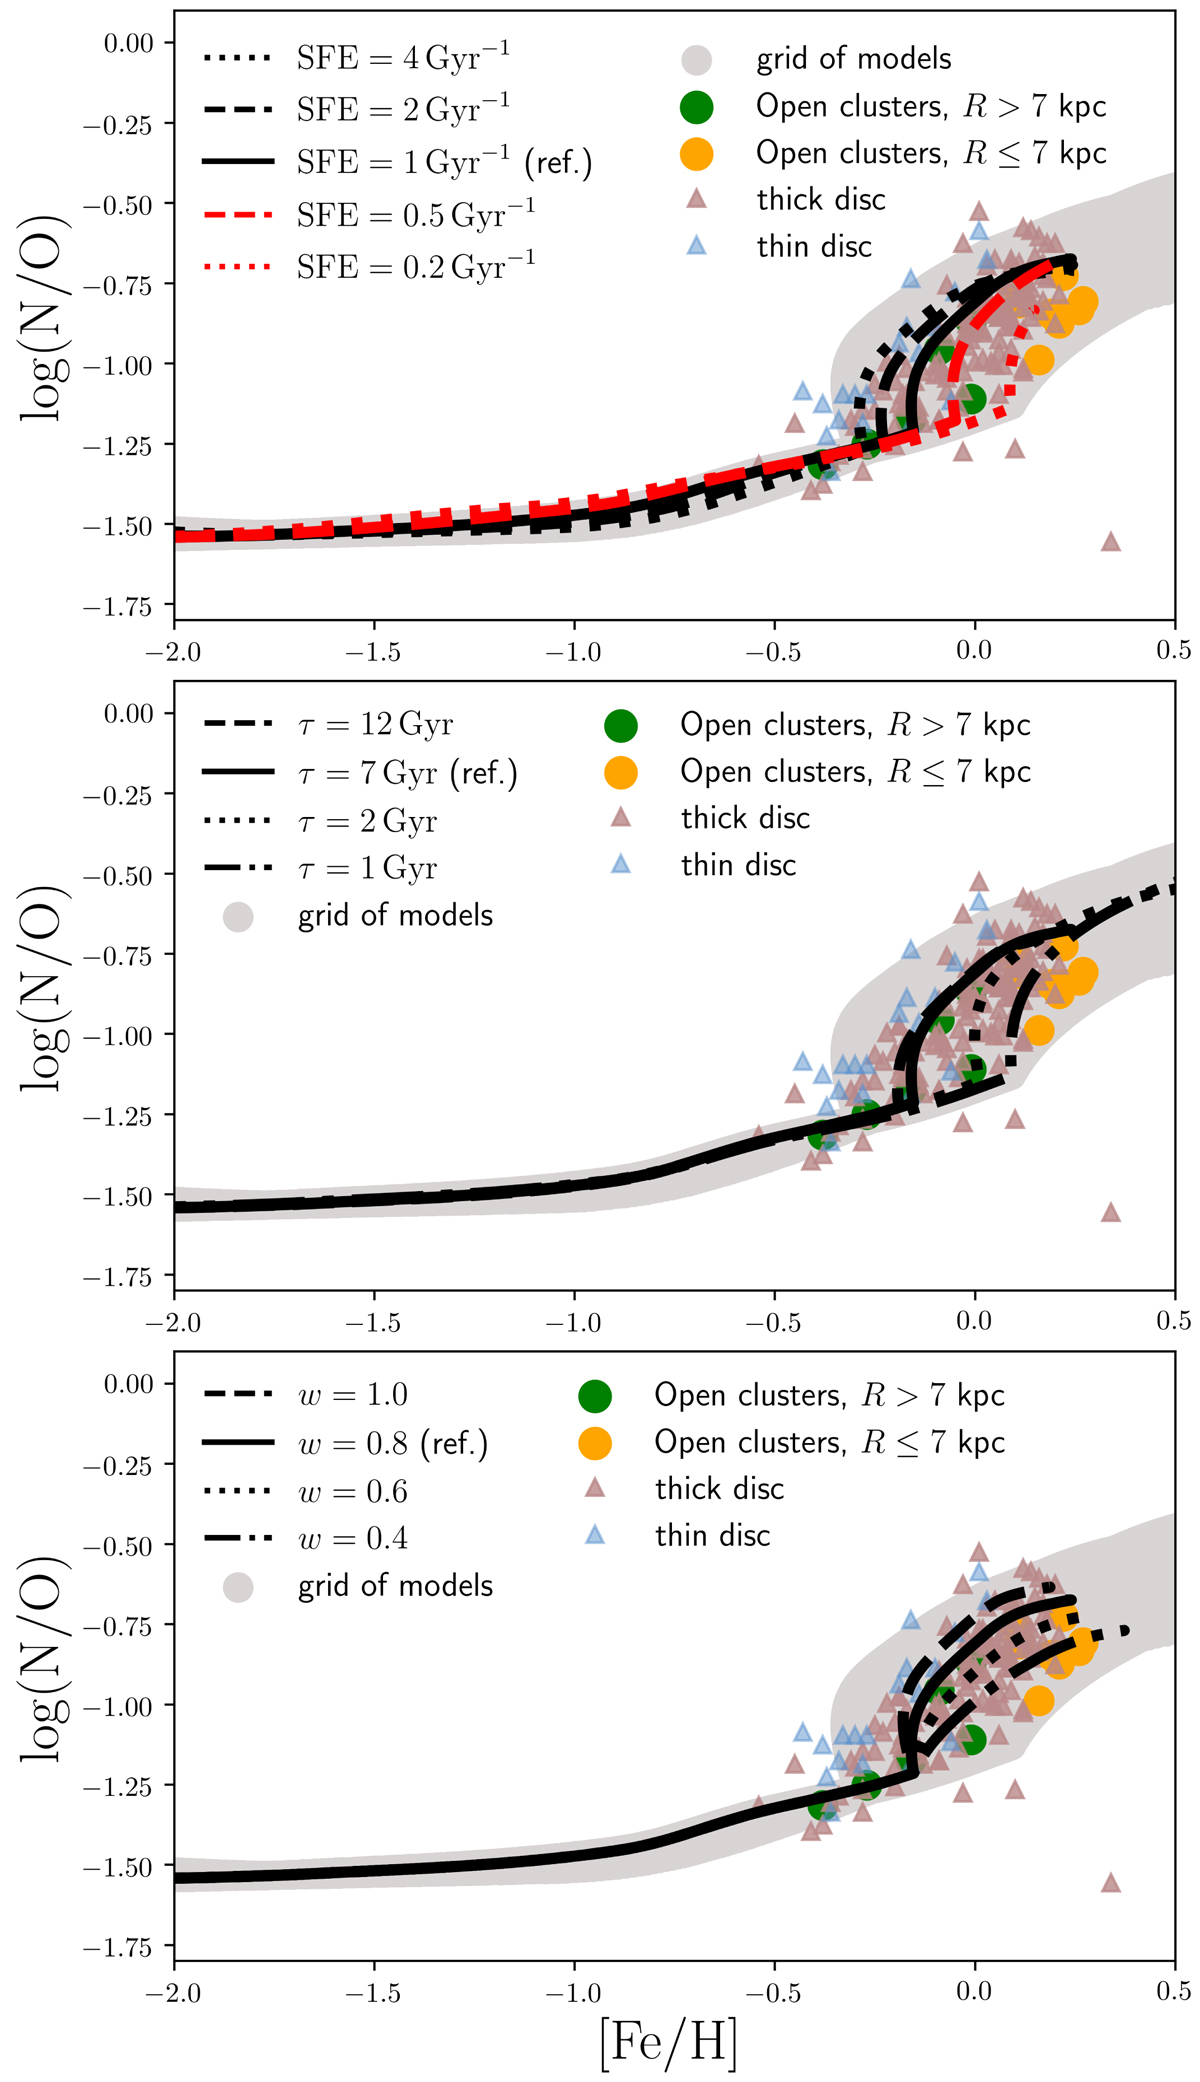
log(N/O) versus [Fe/H] with open clusters shown as large filled circle (in green clusters with RGC > 7 kpc and in orange clusters with RGC ≤ 7 kpc), individual measurements of thin and thick disc stars are represented with cyan and pink triangles, respectively. In the top panel, we present the grid of models in which we vary the SFE; in the central panel, the infall timescale is changed, while in the bottom panel, the outflow loading factor is varied. In each panel, the reference model is identified with a solid line.
Current usage metrics show cumulative count of Article Views (full-text article views including HTML views, PDF and ePub downloads, according to the available data) and Abstracts Views on Vision4Press platform.
Data correspond to usage on the plateform after 2015. The current usage metrics is available 48-96 hours after online publication and is updated daily on week days.
Initial download of the metrics may take a while.