Fig. 7.
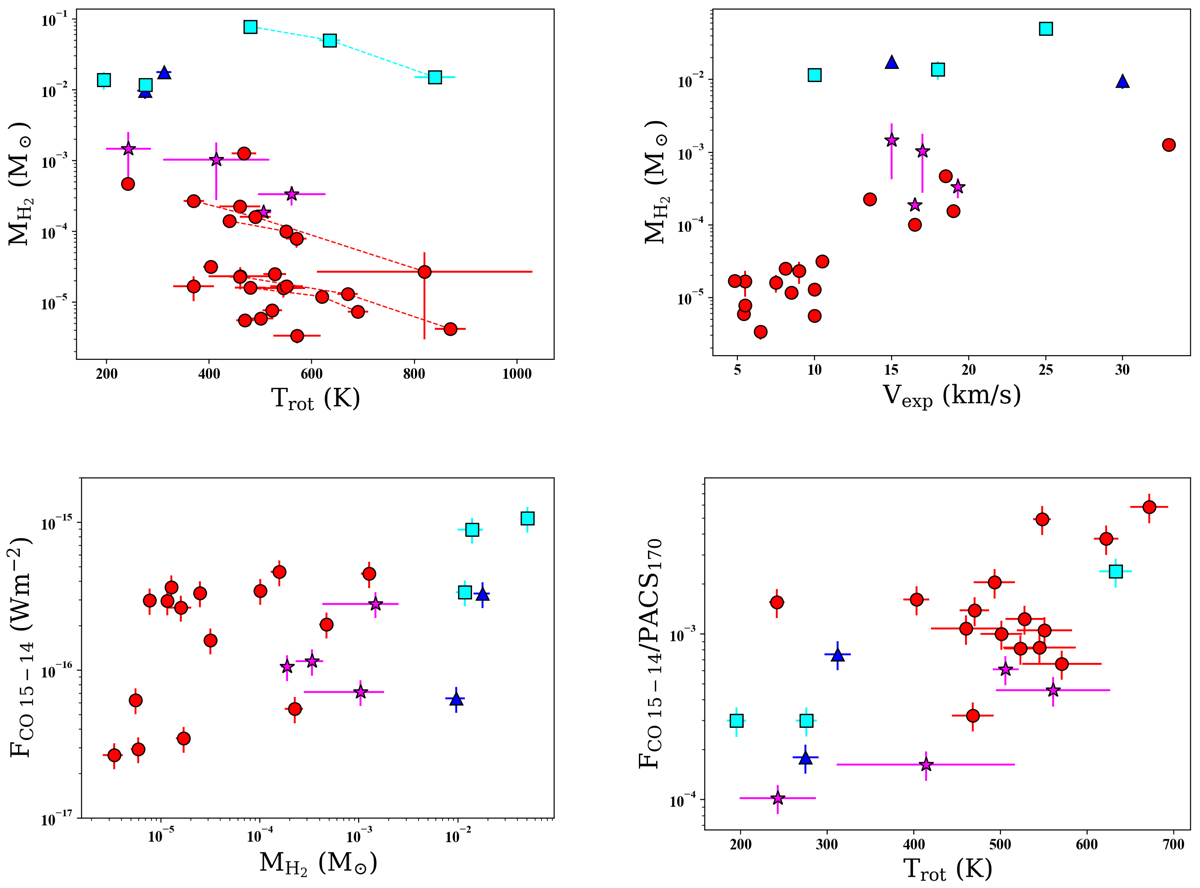
Relation between MH2 and Trotderived from our CO RD analysis and other magnitudes. Top-left: MH2 vs. Trot. For objects (a total of five) with a double-Trot component, both the single-fit and double-fit values are connected with dashed lines for an easier identification. Top-right: values of MH2 (single-fit) vs. vexp taken from the literature. Bottom panels: integrated fluxes of CO (J = 15−14) line vs. MH2 (left) and the same line normalized to its adjacent continuum vs. Trot (right).
Current usage metrics show cumulative count of Article Views (full-text article views including HTML views, PDF and ePub downloads, according to the available data) and Abstracts Views on Vision4Press platform.
Data correspond to usage on the plateform after 2015. The current usage metrics is available 48-96 hours after online publication and is updated daily on week days.
Initial download of the metrics may take a while.