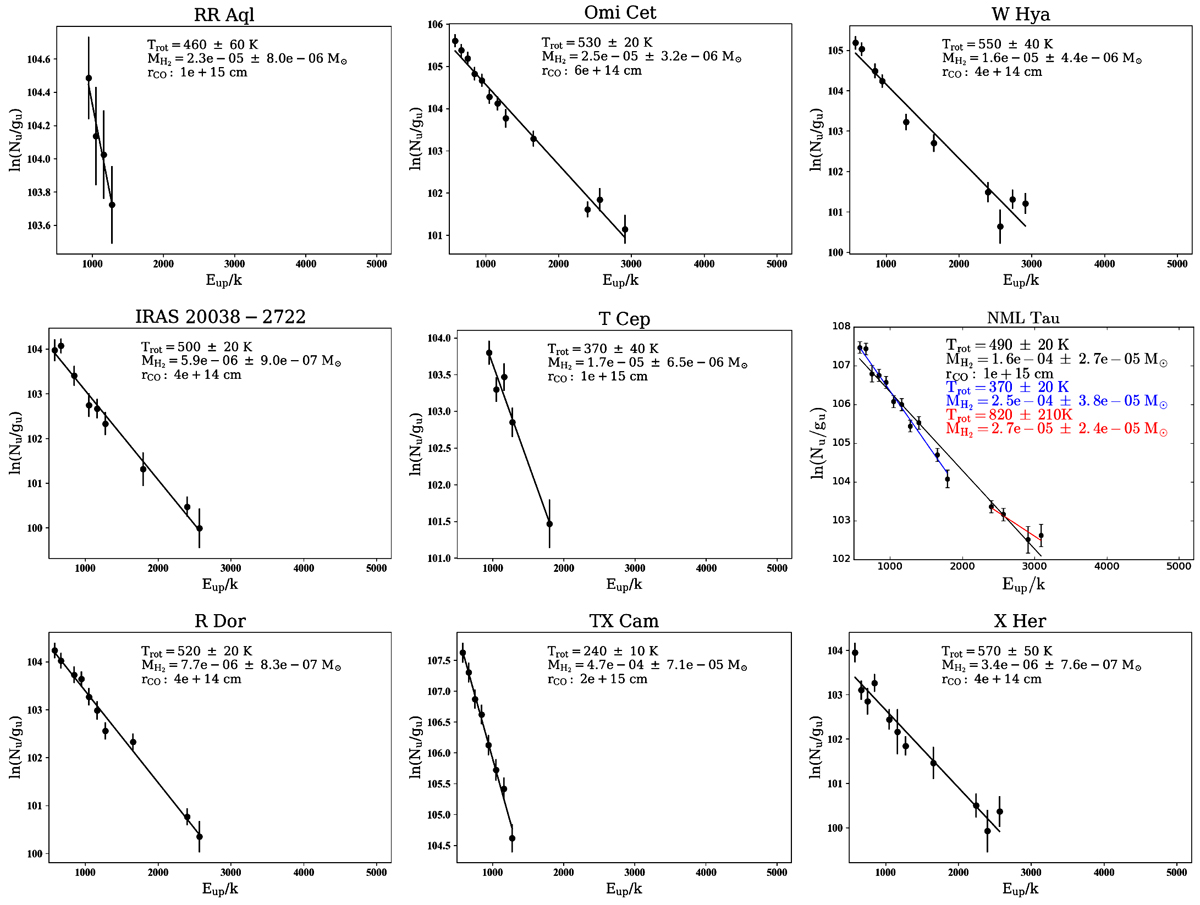
Fig. 5.

RDs of CO for our targets (continues in 5b and 5c). For each source, the values of Trot and MH2 derived from the fits (solid lines) as well as the characteristic radius of the emitting envelope layers adopted (RCO) are shown (Sect. 5). The errors of Trot and MH2 represent the uncertainty of the fit considering the error bars of the individual points, which include formal errors due to the noise and absolute flux uncertainty of the PACS spectra. For a few sources, a double component fit was necessary. For these cases, the values of Trot and MH2 for the so-called warm (blue) and hot (red) components are also indicated.
Current usage metrics show cumulative count of Article Views (full-text article views including HTML views, PDF and ePub downloads, according to the available data) and Abstracts Views on Vision4Press platform.
Data correspond to usage on the plateform after 2015. The current usage metrics is available 48-96 hours after online publication and is updated daily on week days.
Initial download of the metrics may take a while.


