Fig. 4.
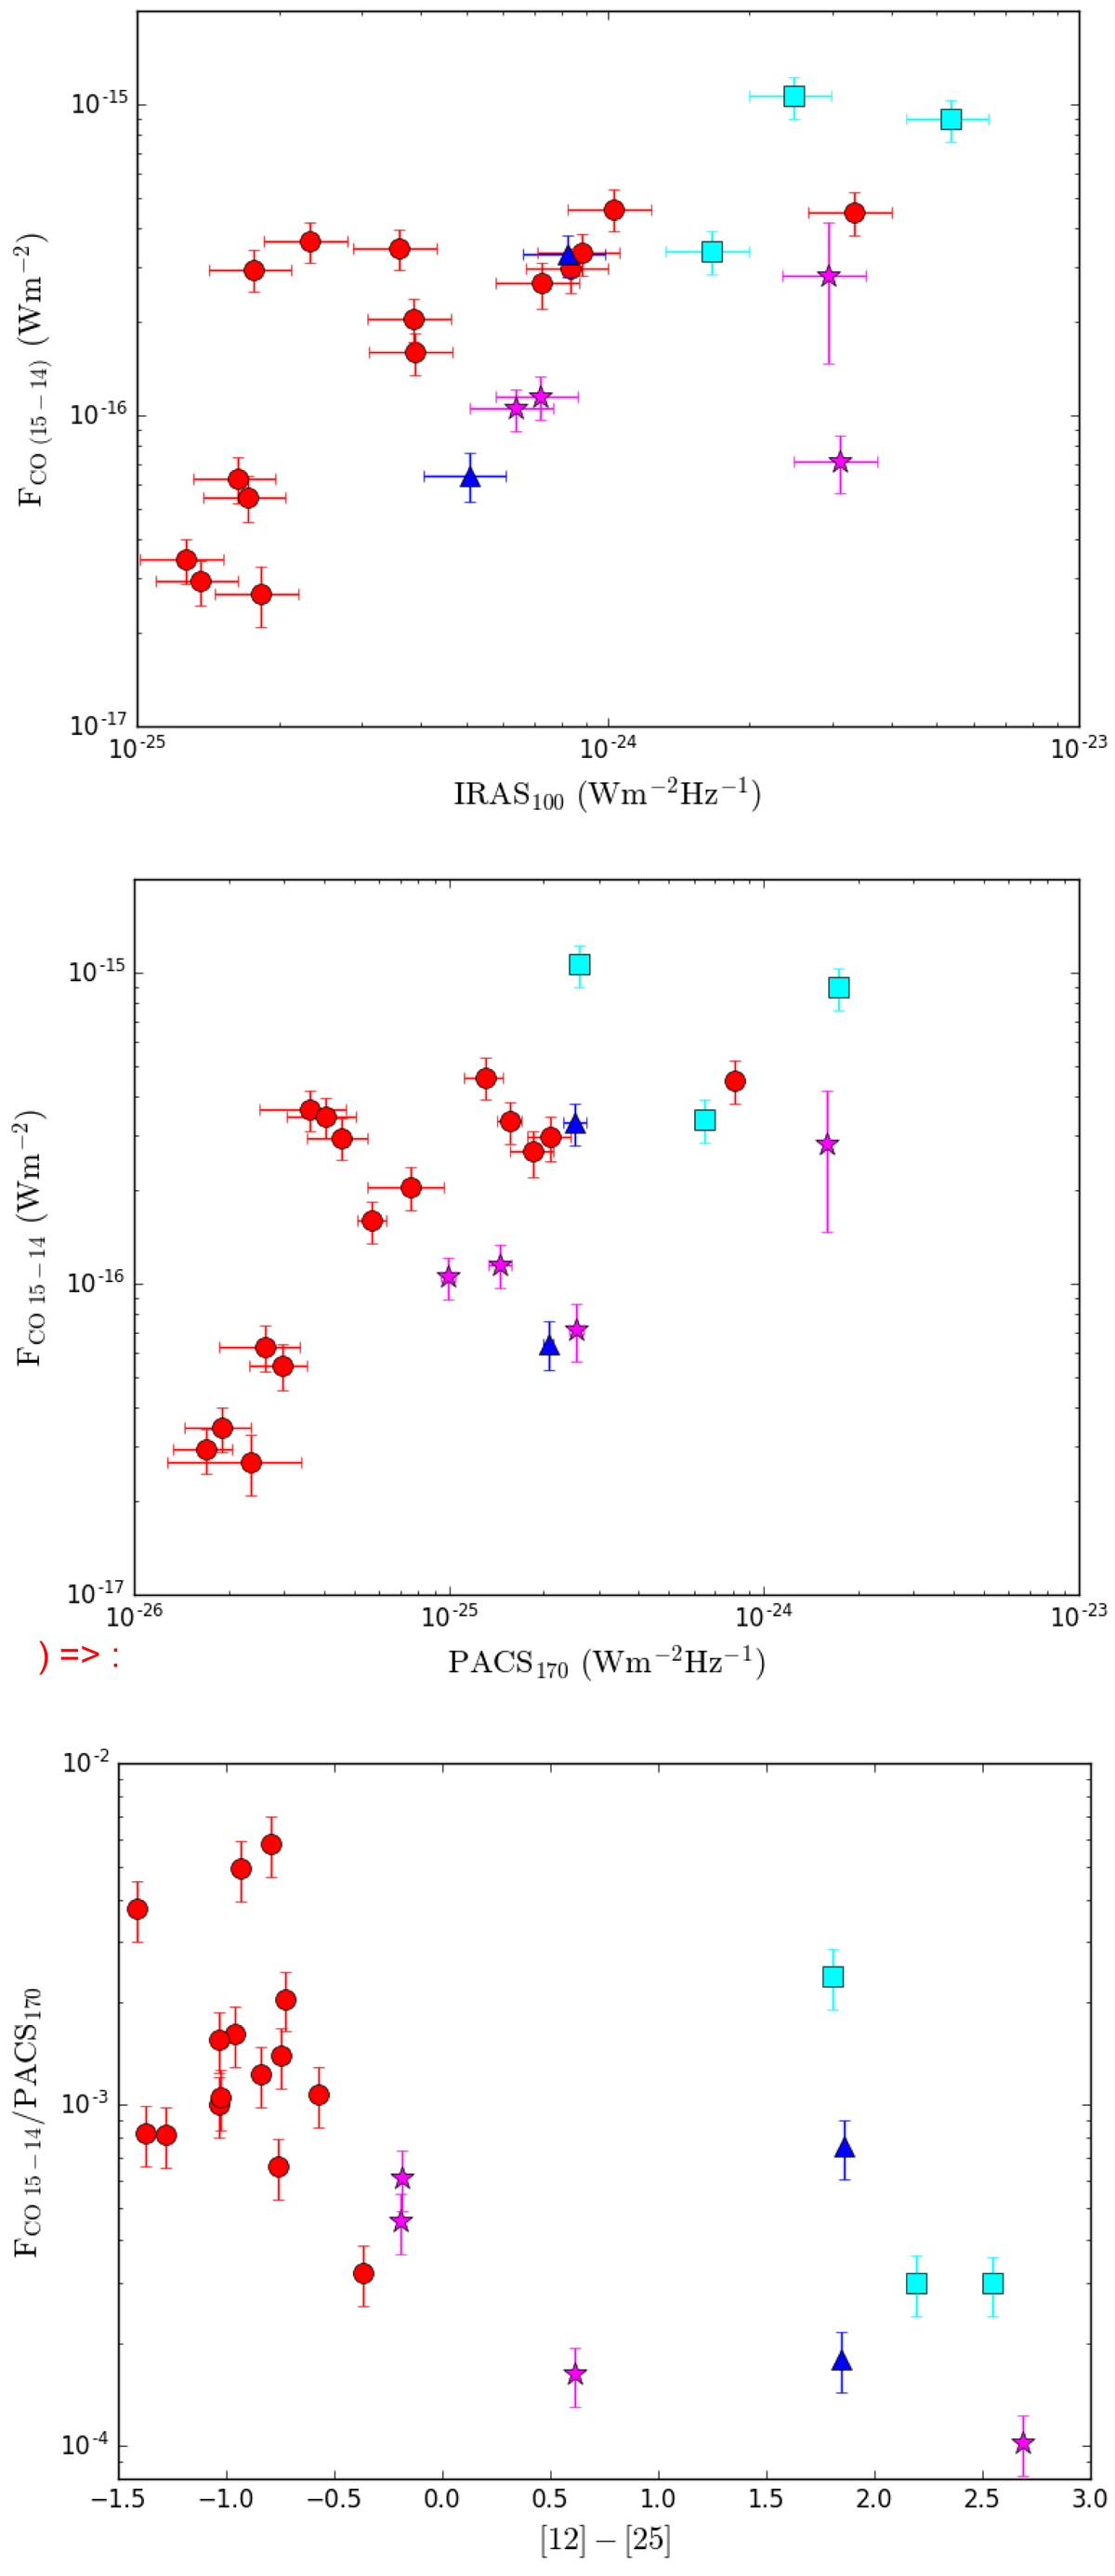
Top: integrated flux of the CO J = 15−14 transition at 173.6 μm (FCO 15−14) against the IRAS 100 μm flux. Targets with no PACS data beyond ∼145 μm (i.e. not covering this CO transition; RR Aql and T Cep – see Fig. 3) or with bad quality (Quality Flag≠3) IRAS100 data (OH 26.5+0.6) are excluded. Middle: fluxes of the CO J = 15−14 transition and the adjacent continuum (PACS170). In this diagram, OH 26.5+0.6 is included. Bottom: line-to-continuum (F CO 15−14-to-PACS170) flux ratio against the IRAS colour [12]−[25].
Current usage metrics show cumulative count of Article Views (full-text article views including HTML views, PDF and ePub downloads, according to the available data) and Abstracts Views on Vision4Press platform.
Data correspond to usage on the plateform after 2015. The current usage metrics is available 48-96 hours after online publication and is updated daily on week days.
Initial download of the metrics may take a while.