Fig. C.1.
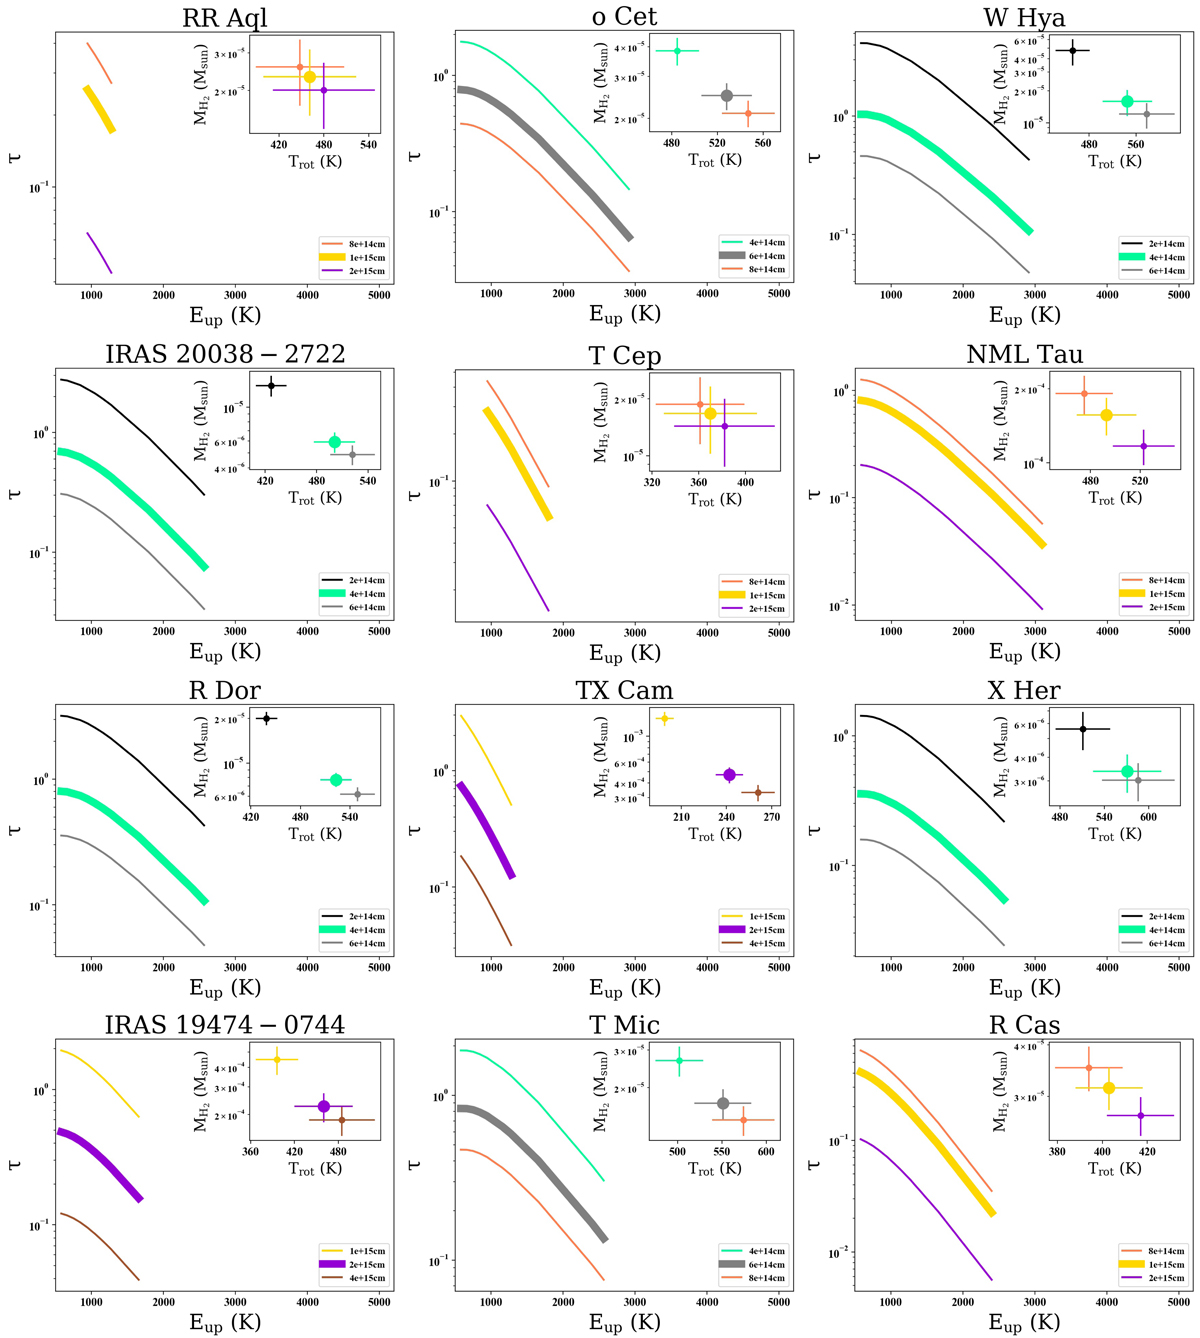
Plots of τ vs. Eup corresponding to different linear radii. In each chart there is a subgraphic showing MH2 vs. Trot. The thickest curve and the biggest point are those associated to the rCO shown in Table D.3.
Current usage metrics show cumulative count of Article Views (full-text article views including HTML views, PDF and ePub downloads, according to the available data) and Abstracts Views on Vision4Press platform.
Data correspond to usage on the plateform after 2015. The current usage metrics is available 48-96 hours after online publication and is updated daily on week days.
Initial download of the metrics may take a while.