Fig. 1.
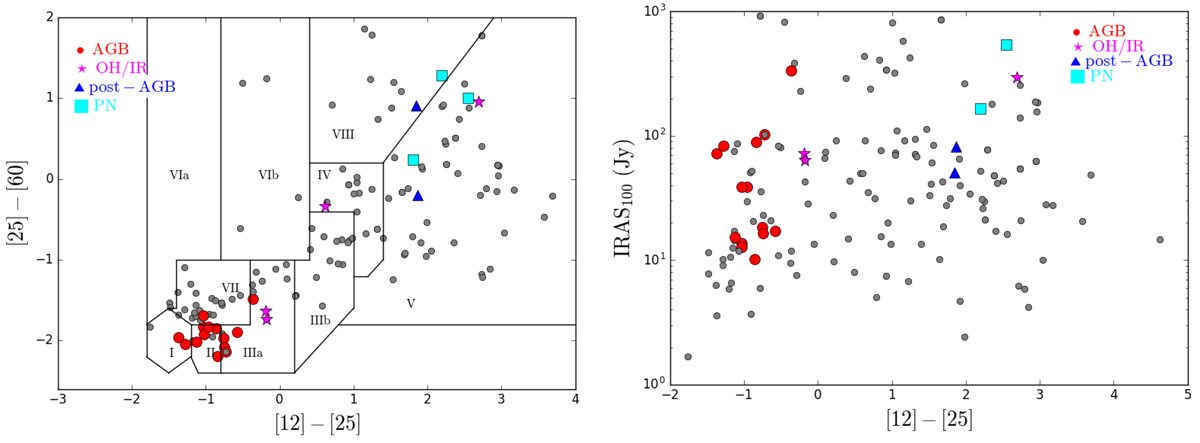
IRAS colour–colour diagram (left) and 100 μm flux vs. [12]−[25] IRAS colour (right) of the THROES targets with good quality IRAS data (Quality Flag = 3) in the 12, 25, 60 and 100 μm bands. The colour–colour diagram is divided in different boxes where sources with common characteristics and evolutionary stages are located (see van der Veen & Habing 1988, for details). Objects with CO line detections, studied in this work, are highlighted using the symbol and colour code shown in the figure. In the rest of the plots presented throughout this paper, AGBs, OH/IRs, post-AGBs and PNe are coloured and symbol-coded as indicated in this figure.
Current usage metrics show cumulative count of Article Views (full-text article views including HTML views, PDF and ePub downloads, according to the available data) and Abstracts Views on Vision4Press platform.
Data correspond to usage on the plateform after 2015. The current usage metrics is available 48-96 hours after online publication and is updated daily on week days.
Initial download of the metrics may take a while.