Fig. 2
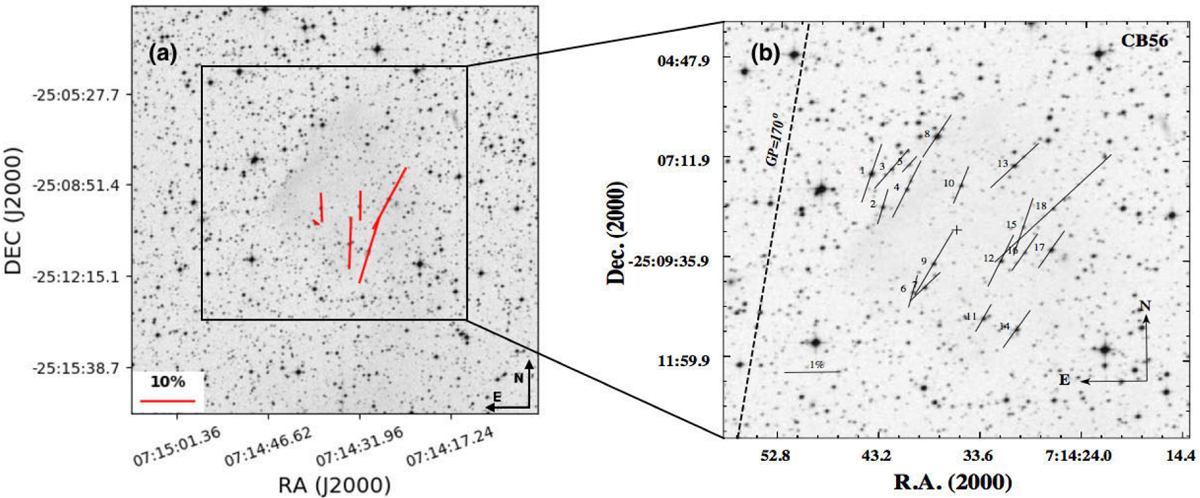
Panel a: near-IR polarization segments plotted over a 15′× 15′ R-Band DSSimage of the field containing CB56. A 10% polarization segment is drawn for reference in the lower left corner. Only the segments with P∕σp ≥ 3 are plotted. Panel b: optical polarization segments of CB56, plotted over a 10′ × 10′ R-Band DSS image (Chakraborty et al. 2014). A 1% polarization segment is drawn for reference in the lower left corner. The near-IR and optical polarization is strong and well ordered, indicating dominant magnetic fields on scales of 104 – 105 au (~ 0.05–0.5pc).
Current usage metrics show cumulative count of Article Views (full-text article views including HTML views, PDF and ePub downloads, according to the available data) and Abstracts Views on Vision4Press platform.
Data correspond to usage on the plateform after 2015. The current usage metrics is available 48-96 hours after online publication and is updated daily on week days.
Initial download of the metrics may take a while.