Fig. 9.
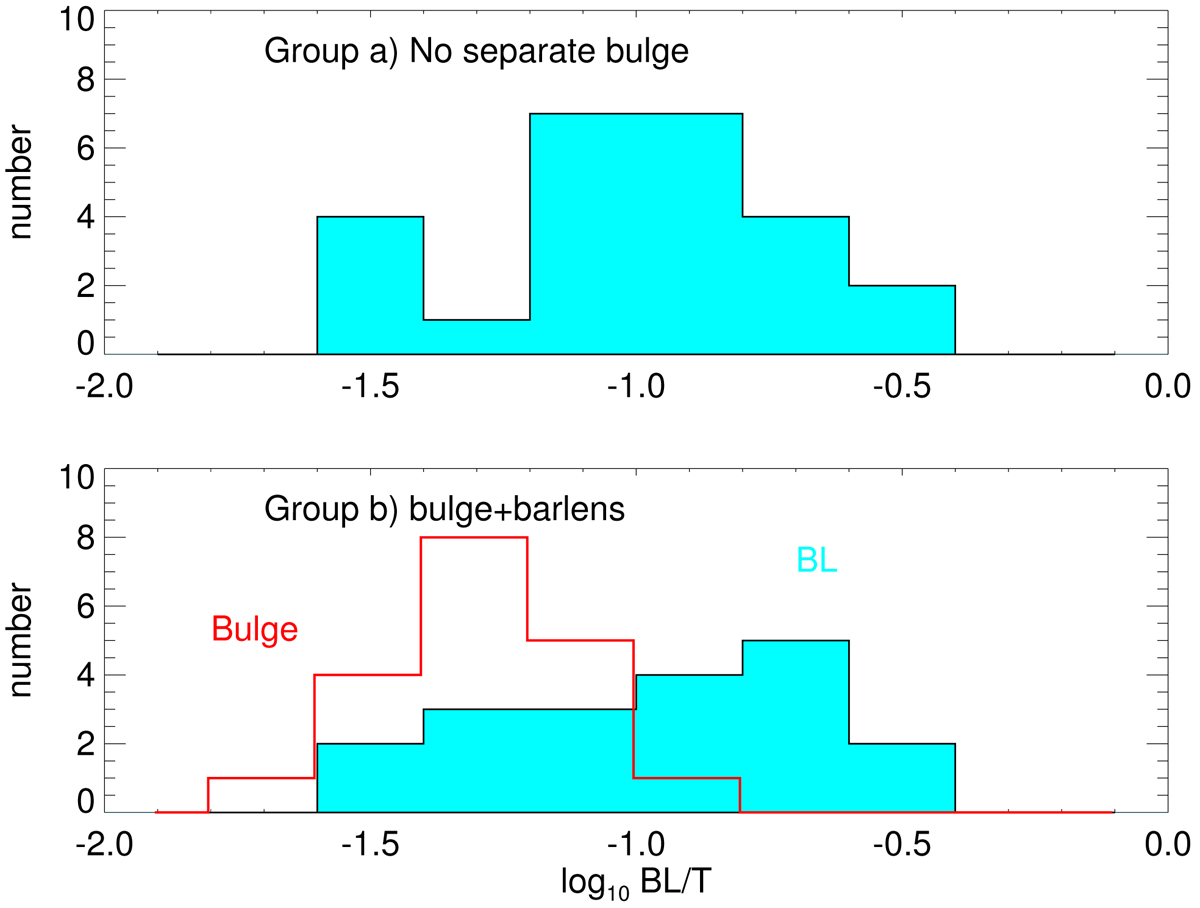
Twenty-six barlens galaxies are divided into groups (a; upper panel) and (b; lower panel) as explained in Sect. 6. The blue histograms indicate the barlens flux fraction BL/T. Additionally, the red histogram (same as in Fig. 5, lowermost frame) in the lower frame shows the relative fluxes of the separate bulge components in the group (b) galaxies.
Current usage metrics show cumulative count of Article Views (full-text article views including HTML views, PDF and ePub downloads, according to the available data) and Abstracts Views on Vision4Press platform.
Data correspond to usage on the plateform after 2015. The current usage metrics is available 48-96 hours after online publication and is updated daily on week days.
Initial download of the metrics may take a while.