Fig. 7.
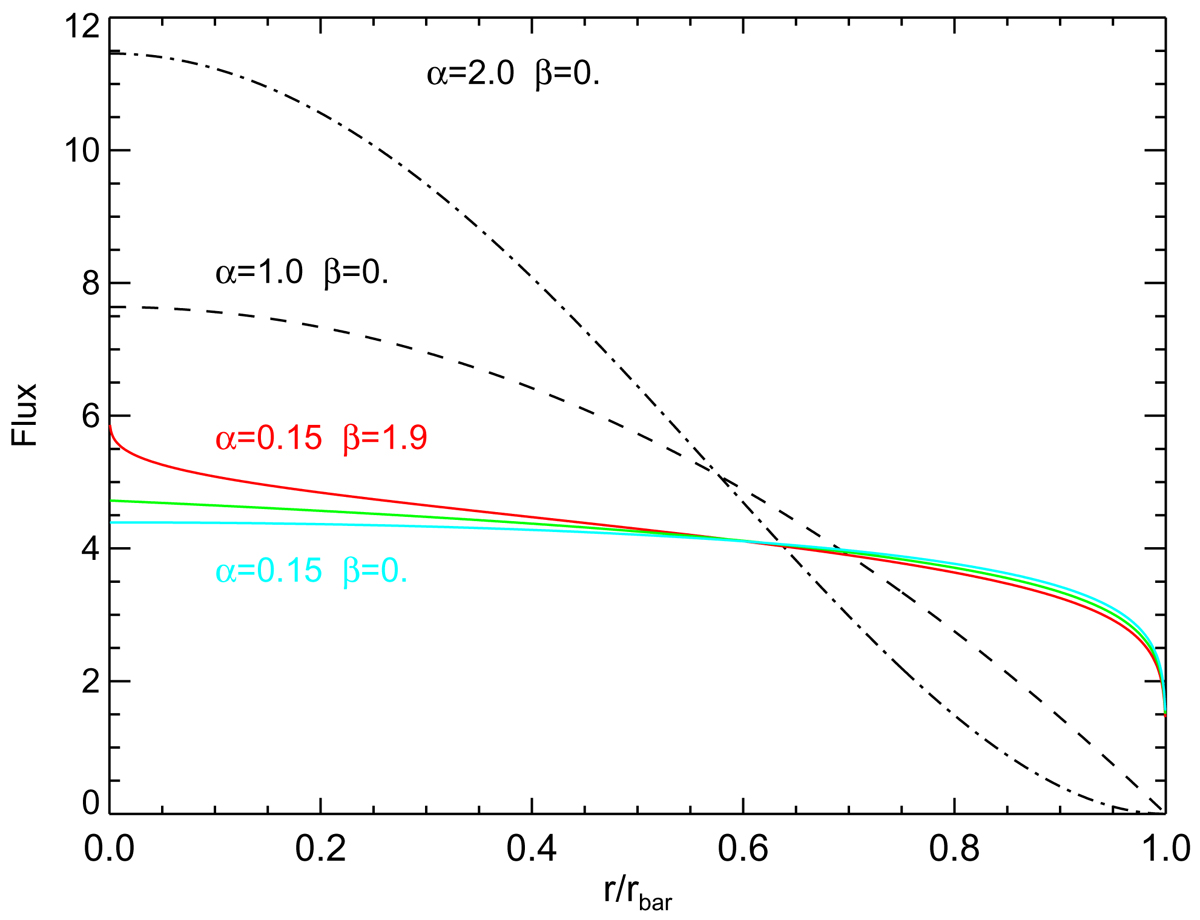
Surface brightness profiles for the theoretical Ferrers function using different values for the parameters α and β, related to the sharpness of the outer truncation and the central slope of the profile, respectively. The lines indicate different combinations of α and β; the red line shows the typical values obtained in the current study. The different curves are normalized to correspond to the same total bar flux.
Current usage metrics show cumulative count of Article Views (full-text article views including HTML views, PDF and ePub downloads, according to the available data) and Abstracts Views on Vision4Press platform.
Data correspond to usage on the plateform after 2015. The current usage metrics is available 48-96 hours after online publication and is updated daily on week days.
Initial download of the metrics may take a while.