Fig. 4.
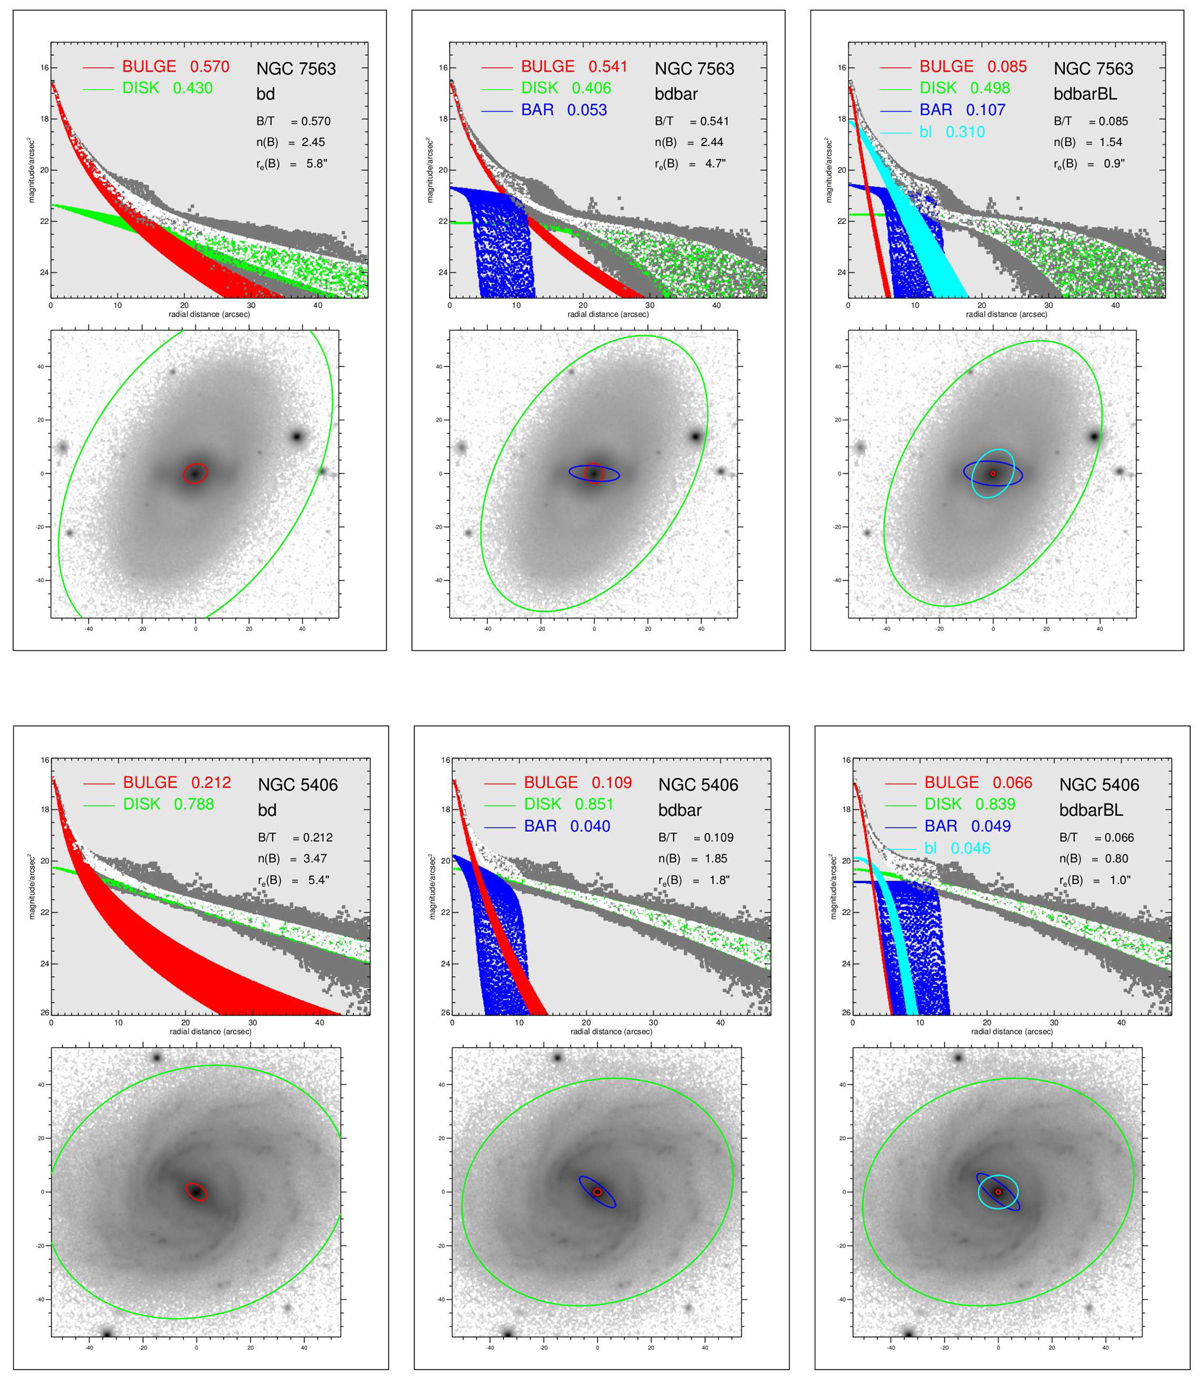
Three decomposition models (B/D, B/D/bar, and B/D/bar/bl) shown for the galaxies NGC 7563 and NGC 5406. In the upper panels, the 2D representations of the surface brightness profiles are shown; black dots show the fluxes of the image pixels as a function of distance in the sky plane, and the white dots those of the total model images. The colors illustrate the fitted models of various structure components. Lower panels: r′-band mosaic images overplotted with the effective radii of the fitted models.
Current usage metrics show cumulative count of Article Views (full-text article views including HTML views, PDF and ePub downloads, according to the available data) and Abstracts Views on Vision4Press platform.
Data correspond to usage on the plateform after 2015. The current usage metrics is available 48-96 hours after online publication and is updated daily on week days.
Initial download of the metrics may take a while.