Fig. 3.
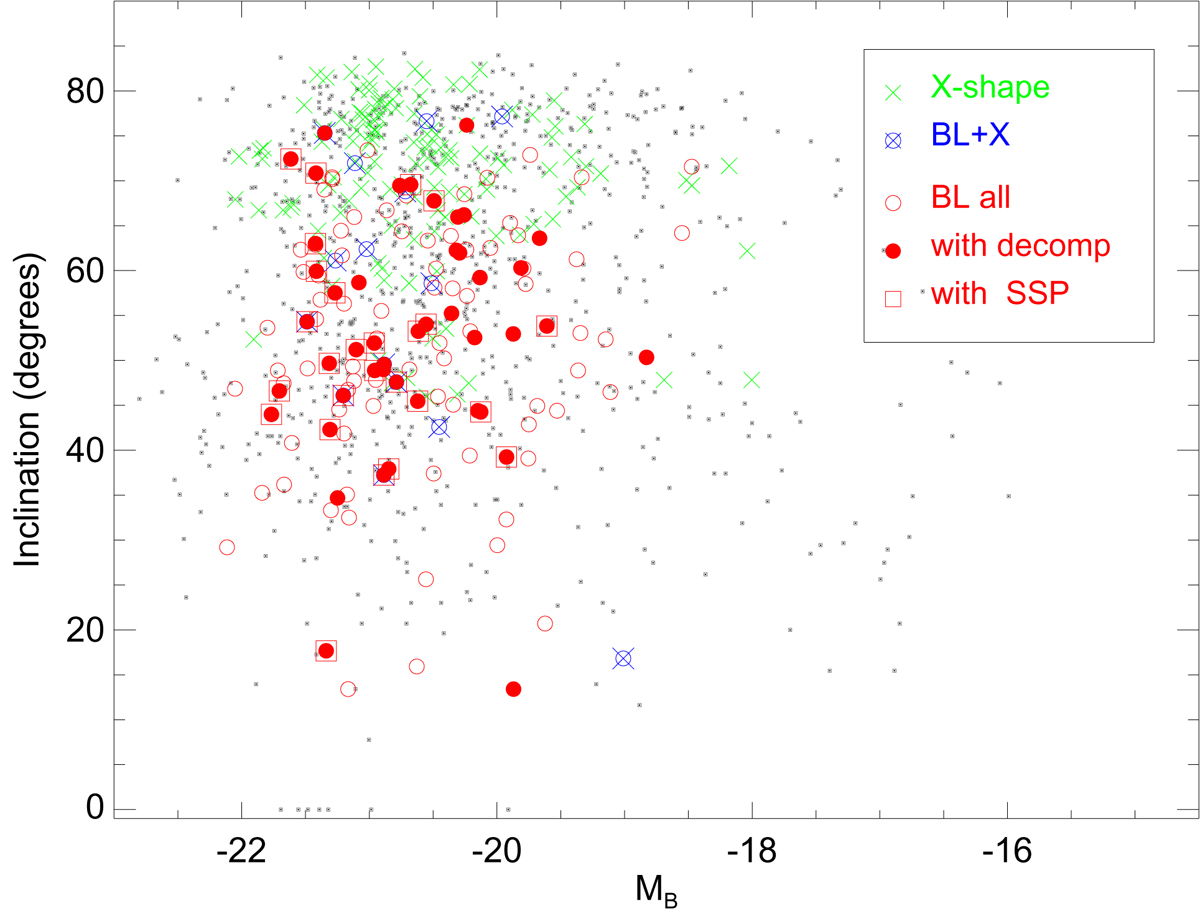
Galaxy inclination plotted as a function of the absolute B-band galaxy magnitude. The parameter values are from HyperLEDA. Gray dots indicate galaxies in the complete CALIFA sample of 1064 galaxies, green symbols show the X-shaped bars, red symbols the barlenses, and blue symbols the galaxies in which both features appeared. Filled red circles denote the barlens galaxies for which we made the decomposition, and open squares the 26 galaxies, for which the V500 grating SSP data cubes were also available.
Current usage metrics show cumulative count of Article Views (full-text article views including HTML views, PDF and ePub downloads, according to the available data) and Abstracts Views on Vision4Press platform.
Data correspond to usage on the plateform after 2015. The current usage metrics is available 48-96 hours after online publication and is updated daily on week days.
Initial download of the metrics may take a while.