Fig. 16.
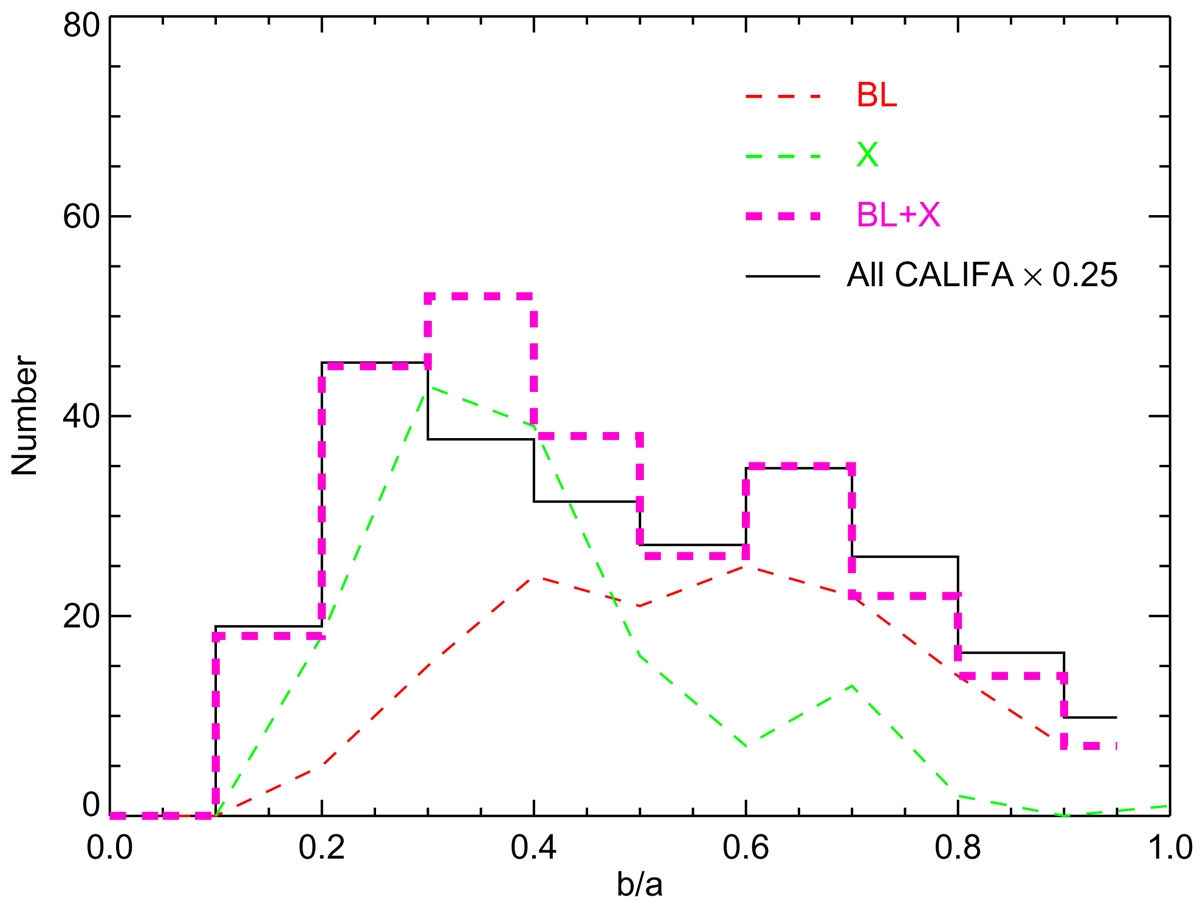
Distributions of the minor-to-major (b/a) axis ratios of the galaxies hosting barlenses (bl; our sample 2) and X-shaped features (X; our sample 3) in the CALIFA sample. The combined bl+X distribution is compared with that of the complete sample of CALIFA galaxies (our sample 1), scaled by a factor of 0.25. The histograms for both bl and X include the 15 galaxies in which both features appear. In the combined bl+X histogram these galaxies are included only once. The b/a values are from our measurements when available, otherwise from HyperLEDA. However, use of HyperLEDA inclinations would yield very similar distributions.
Current usage metrics show cumulative count of Article Views (full-text article views including HTML views, PDF and ePub downloads, according to the available data) and Abstracts Views on Vision4Press platform.
Data correspond to usage on the plateform after 2015. The current usage metrics is available 48-96 hours after online publication and is updated daily on week days.
Initial download of the metrics may take a while.