Fig. 15.
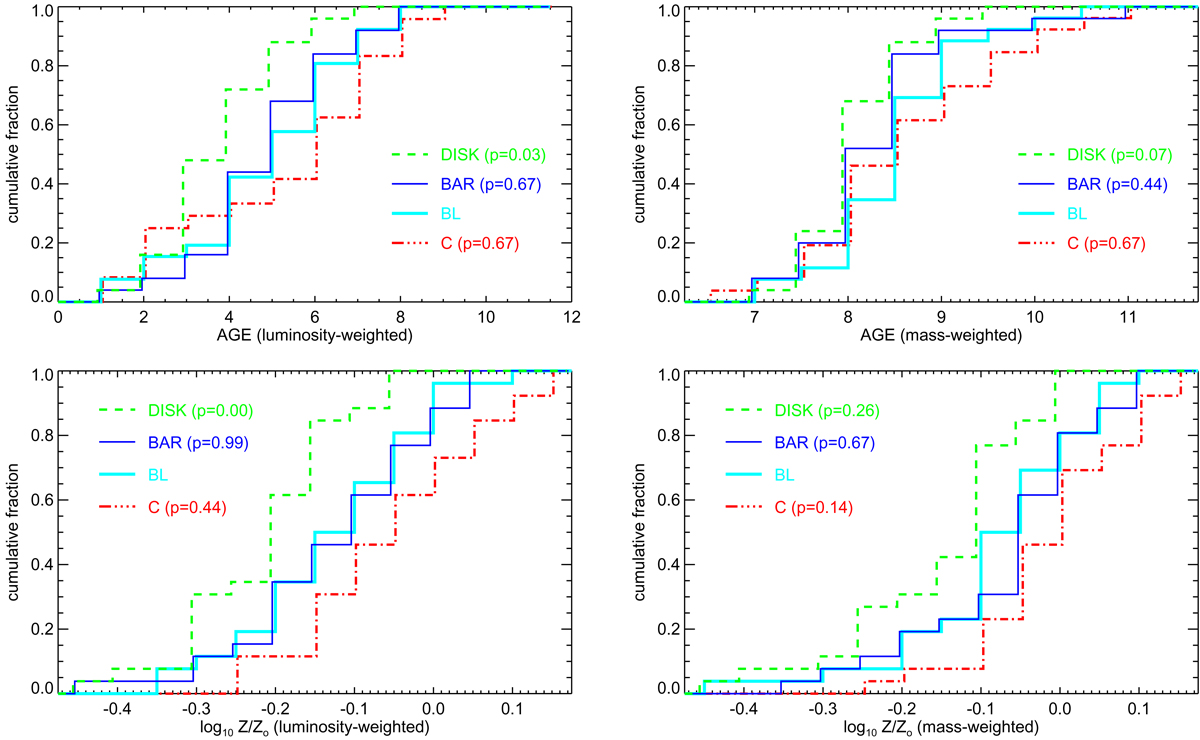
Cumulative distributions of the average ages and metallicities in the different structure components, measured in regions as defined in Fig. 11. Included are the 26 barlens galaxies in our sample. The V500 data cubes by Sánchez et al. (2016a) (SSP.cube.fits) were used, loaded from the CALIFA database. Distributions are based on median values of the pixels covered by the structure components; practically identical distributions are obtained when using flux-weighted means. Labels indicate the p-values in KS-tests comparing the distribution with that of barlenses; p < 0.05 indicates a statistically significant difference.
Current usage metrics show cumulative count of Article Views (full-text article views including HTML views, PDF and ePub downloads, according to the available data) and Abstracts Views on Vision4Press platform.
Data correspond to usage on the plateform after 2015. The current usage metrics is available 48-96 hours after online publication and is updated daily on week days.
Initial download of the metrics may take a while.