Fig. 14.
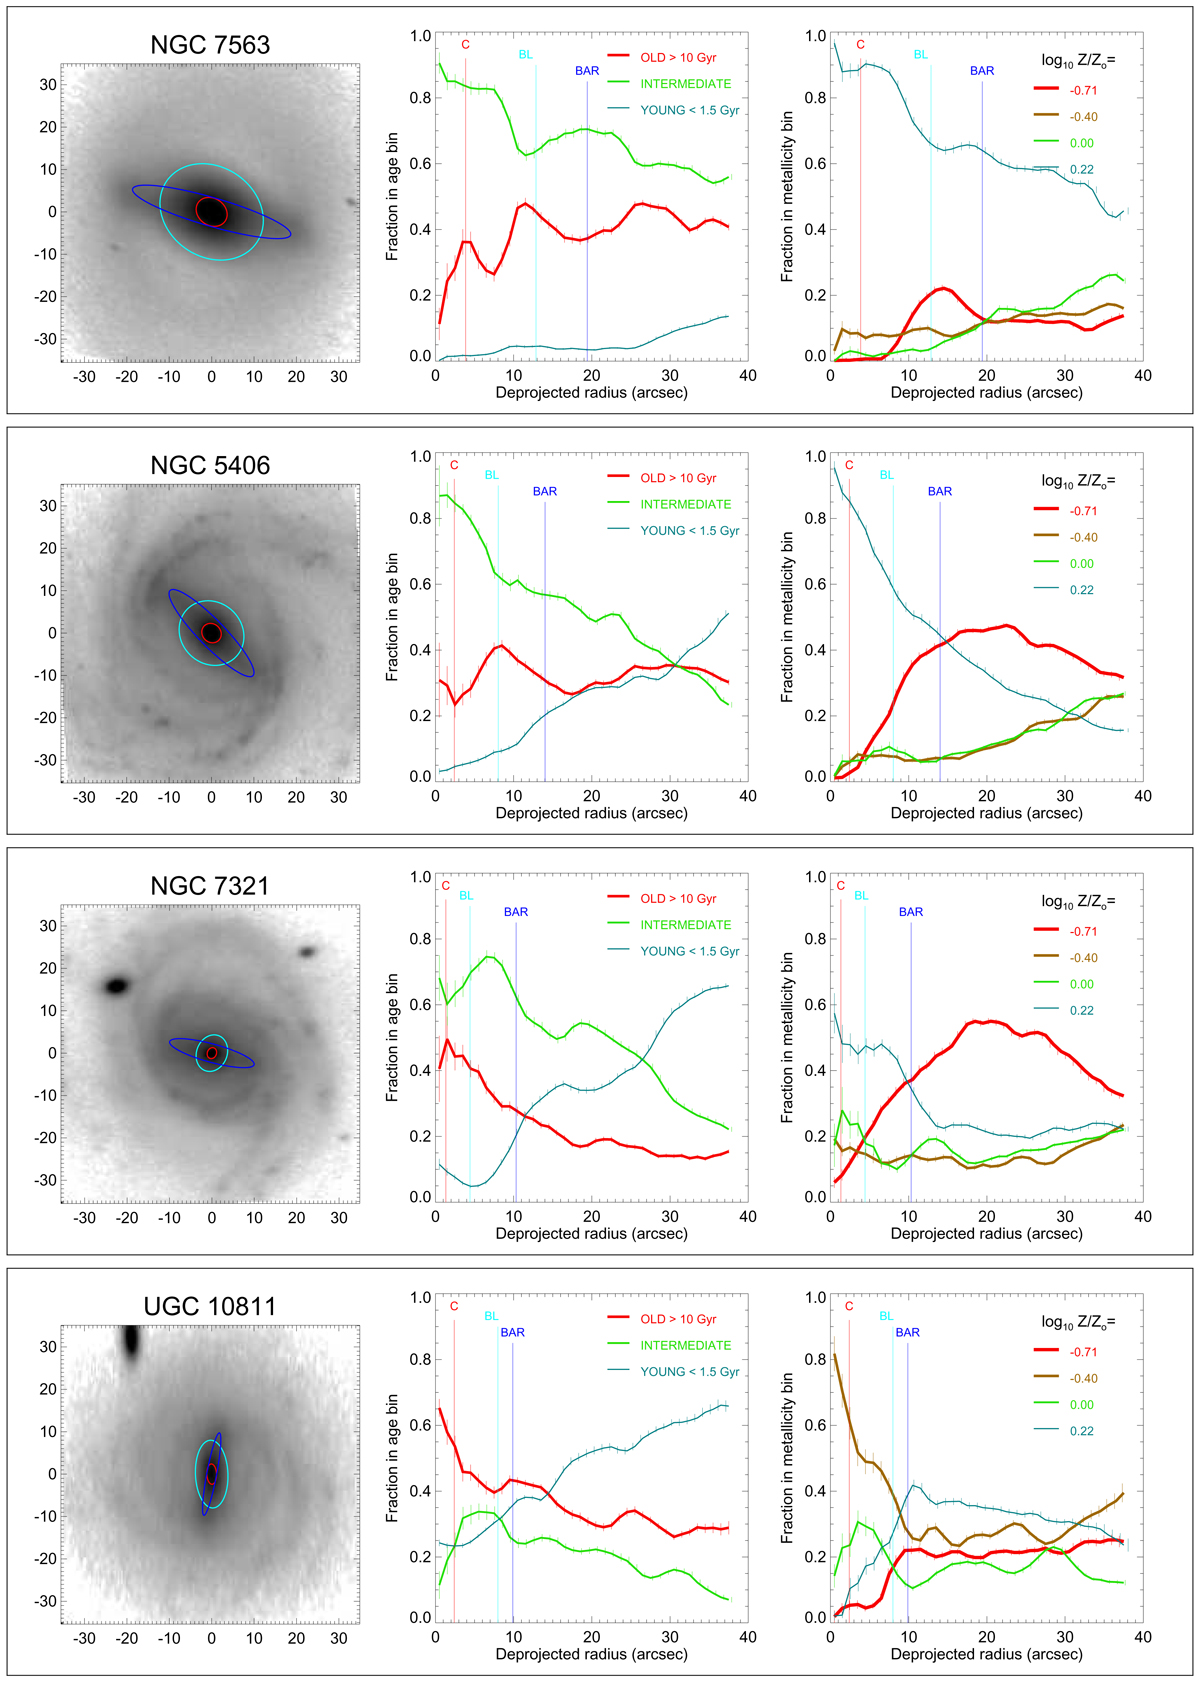
Left: deprojected SDSS r′-band mosaic image. Overplotted are the elliptical zones (see Sect. 7.2) used in the measurement of structure averages shown deprojected to the disk plane (original measurements were carried out in non-deprojected images). Middle: Fractions of stars in the three stellar age bins, as a function of the deprojected radial distance. The profiles are constructed using the V500 grating data cubes from Sánchez et al. (2016b), loaded from CALIFA database (SFH.cube.fits). These profiles correspond to averages over mass and luminosity-weighted star formation histories. The vertical lines show the deprojected semimajor axis lengths of the bars, barlenses, and the central galaxy regions. Right: fractions of stars in four different metallicity bins, as given in the CALIFA data cubes. The meaning of the vertical lines are the same as in the middle panel. For more examples, see Appendix E.
Current usage metrics show cumulative count of Article Views (full-text article views including HTML views, PDF and ePub downloads, according to the available data) and Abstracts Views on Vision4Press platform.
Data correspond to usage on the plateform after 2015. The current usage metrics is available 48-96 hours after online publication and is updated daily on week days.
Initial download of the metrics may take a while.