Free Access
Fig. 12.
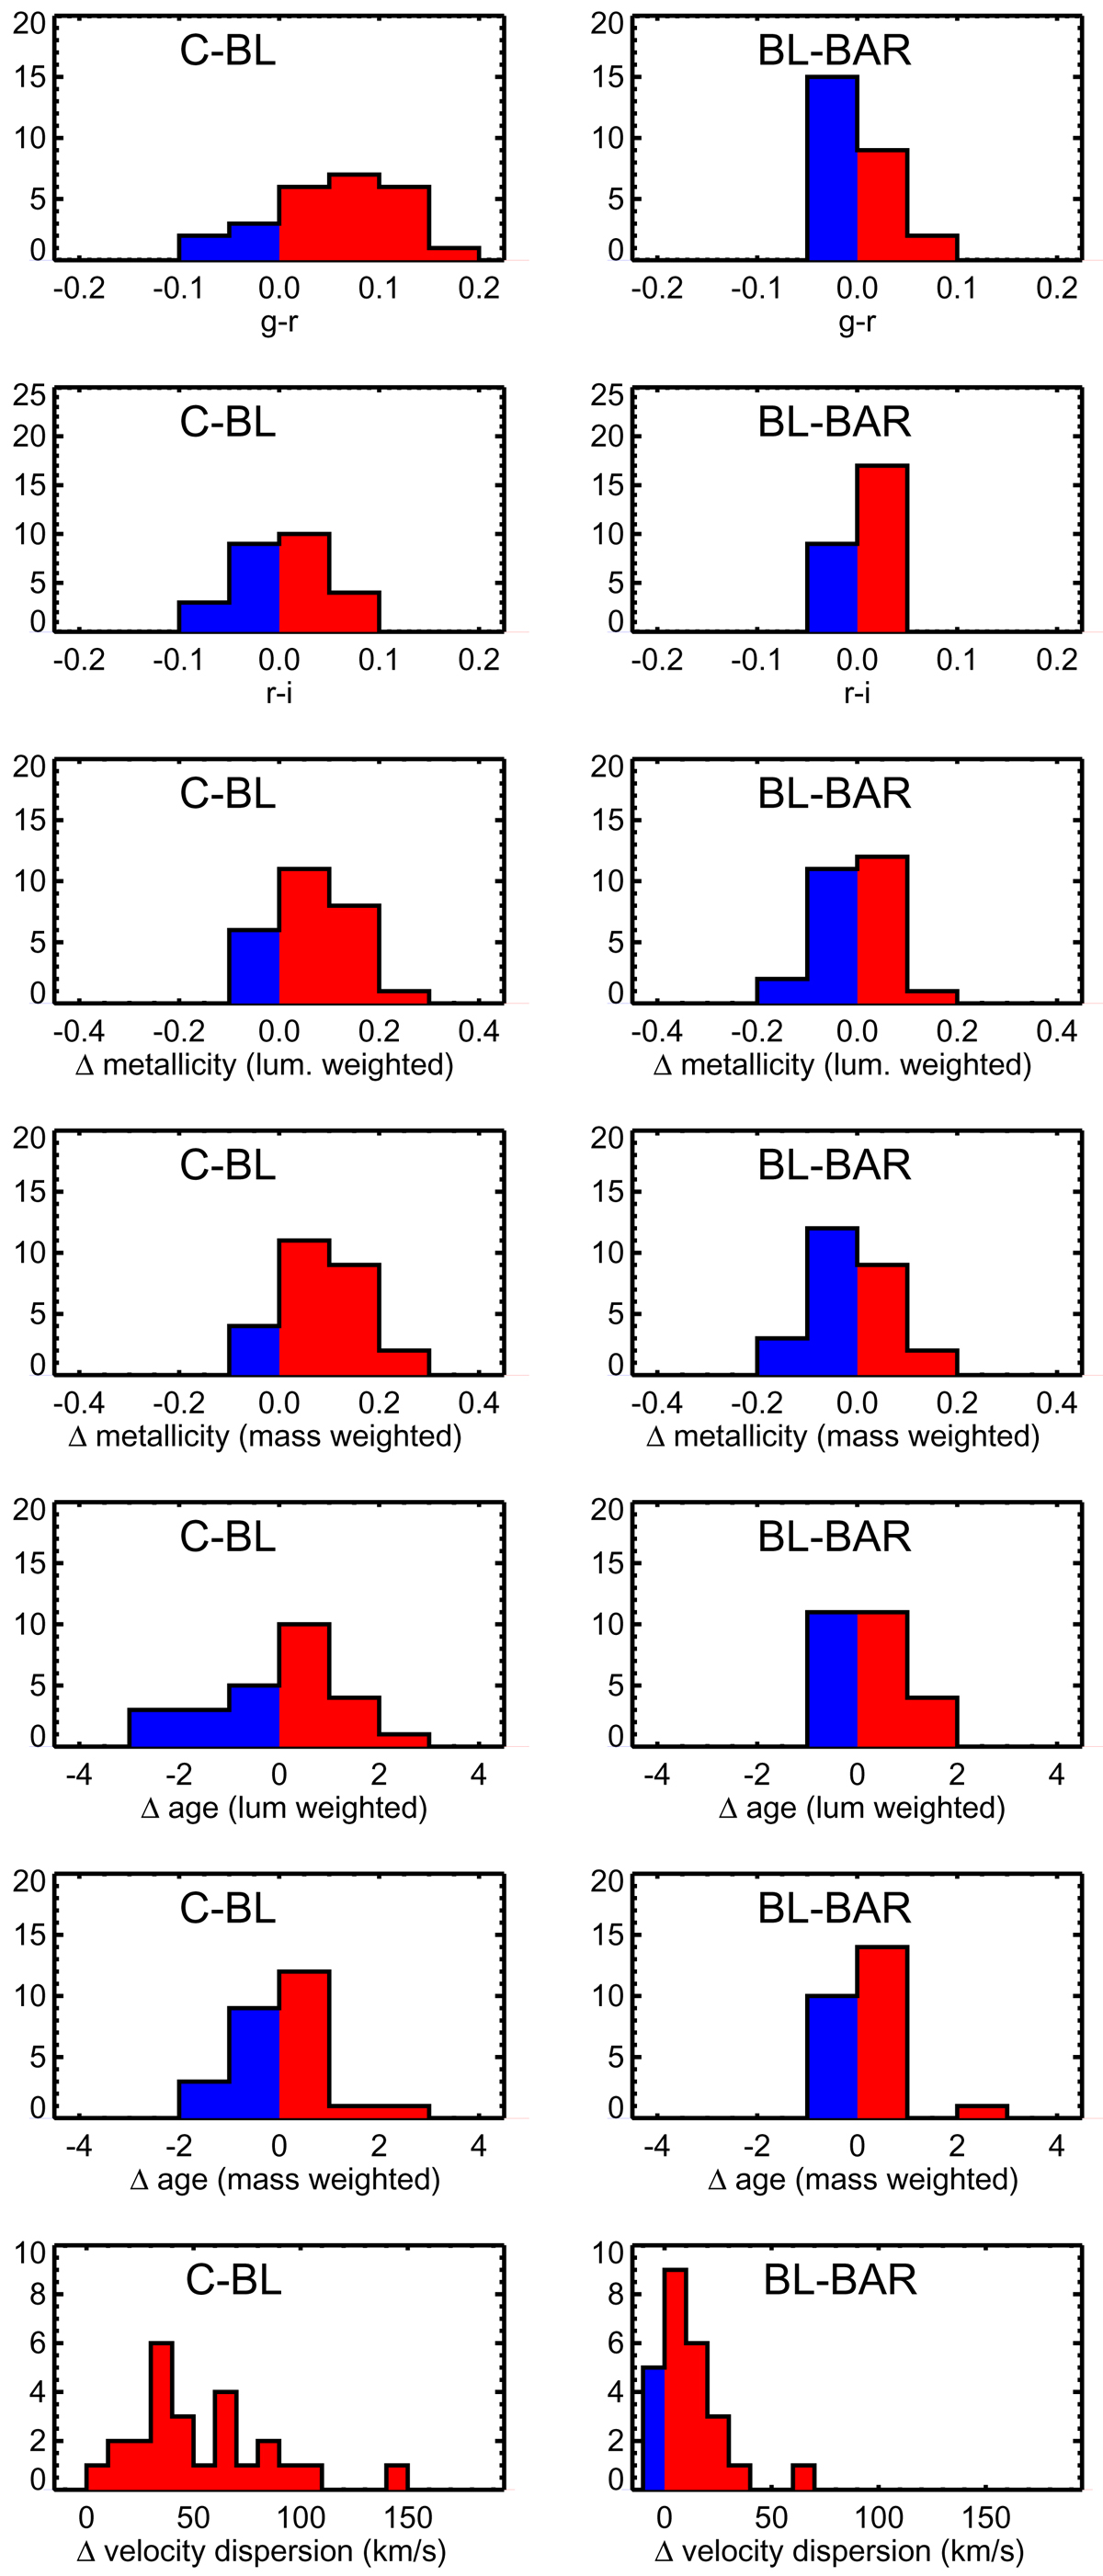
Differences of the parameter values between the central galaxy regions and barlenses (C-BL), and between barlenses and bars (BL-BAR), are shown for the sample of 26 galaxies. Positive and negative deviations are shown with red and blue colors, respectively. The parameters are the same as in Table 3.
Current usage metrics show cumulative count of Article Views (full-text article views including HTML views, PDF and ePub downloads, according to the available data) and Abstracts Views on Vision4Press platform.
Data correspond to usage on the plateform after 2015. The current usage metrics is available 48-96 hours after online publication and is updated daily on week days.
Initial download of the metrics may take a while.