Free Access
Fig. 11.
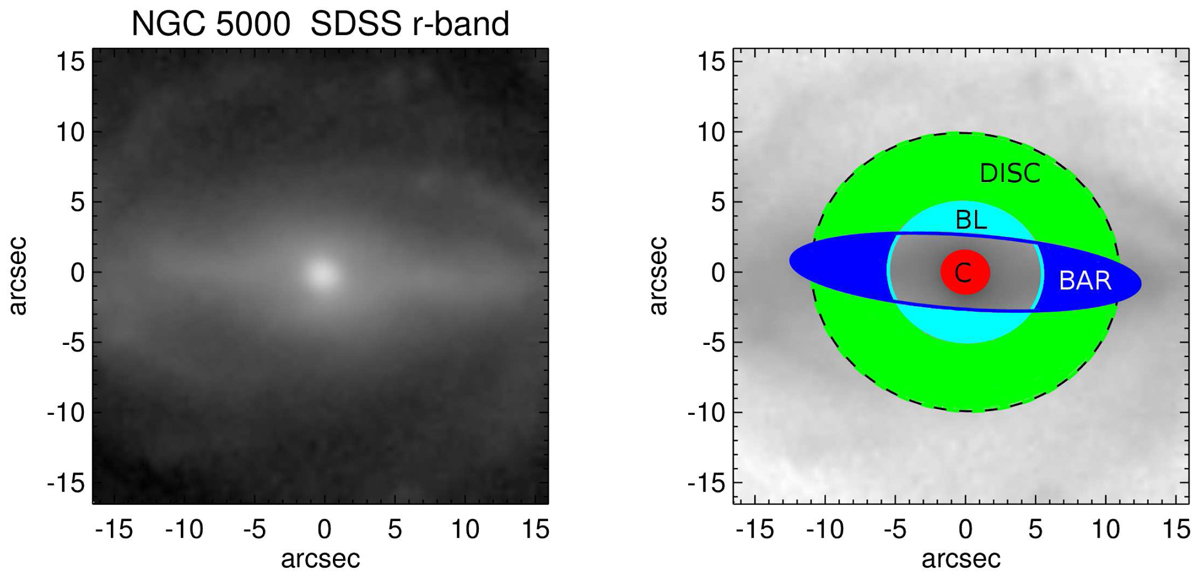
Illustration of the measured galaxy regions, as defined in Sect. 7.2. Left panel: original r′-band mosaic image of NGC 5000 to show the bar region. Right panel: definitions of the regions. Red indicates galaxy center (C), turquoise indicates barlens (bl), blue indicate bar, and green indicates disk.
Current usage metrics show cumulative count of Article Views (full-text article views including HTML views, PDF and ePub downloads, according to the available data) and Abstracts Views on Vision4Press platform.
Data correspond to usage on the plateform after 2015. The current usage metrics is available 48-96 hours after online publication and is updated daily on week days.
Initial download of the metrics may take a while.