Fig. 10.
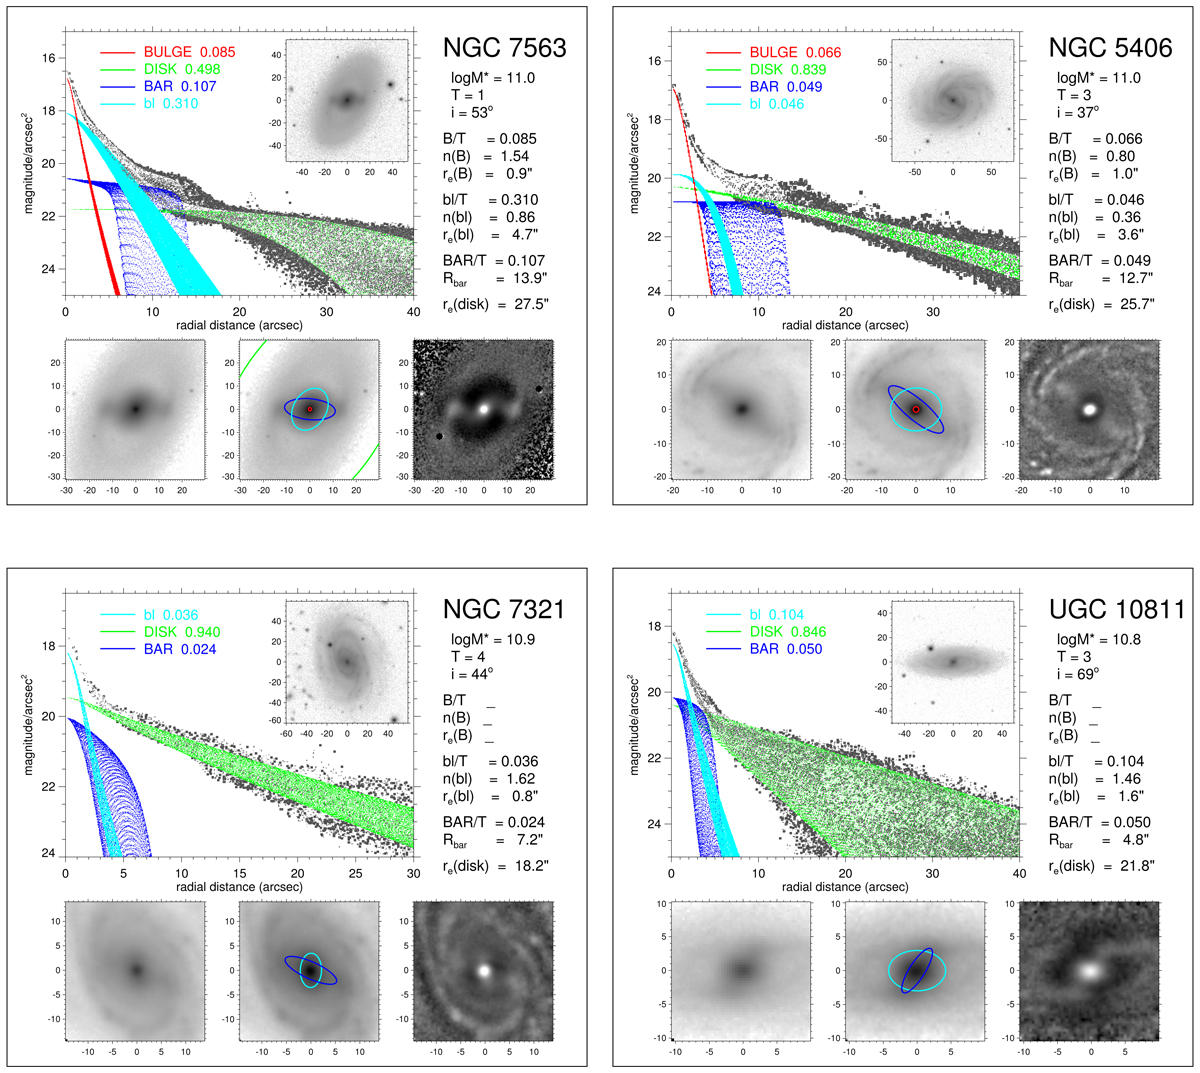
Examples of our multicomponent decompositions. Large panel: black dots show the surface brightnesses (r′ magnitude/arcsec2) of the pixels in the two-dimensional image, white dots the values in the final model image, and the colors the values corresponding to the different structure components of the model. Bulges, disks, and barlenses were fitted with a Sérsic function, and bars with a Ferrers function. The decomposition parameters, galaxy masses (log M⋆), galaxy inclinations (i), and Hubble stages (T) are shown in the upper right. Lower panels (from left to right): region of the r′-band SDSS mosaic image, the same image with the model components plotted on top of that, and the unsharp mask image. The image in the large panel shows the full galaxy image. For more examples, see Appendix E.
Current usage metrics show cumulative count of Article Views (full-text article views including HTML views, PDF and ePub downloads, according to the available data) and Abstracts Views on Vision4Press platform.
Data correspond to usage on the plateform after 2015. The current usage metrics is available 48-96 hours after online publication and is updated daily on week days.
Initial download of the metrics may take a while.