Fig. 1.
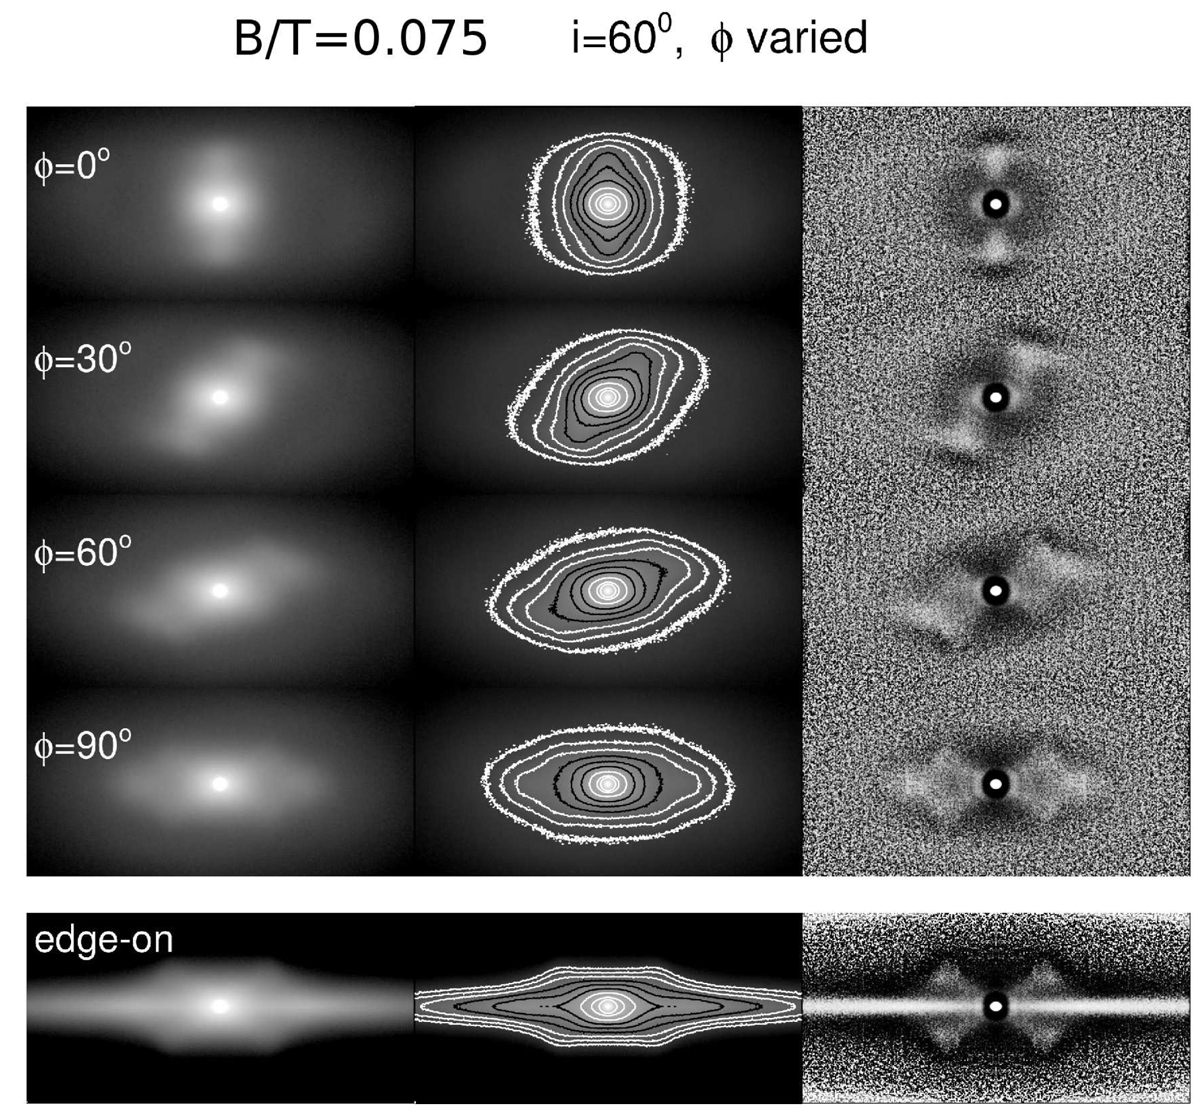
Synthetic simulation images from Laurikainen & Salo (2017). In the left panels the direct image in the magnitude scale is shown, the middle panels show the contours of the same image, and the right panels show the unsharp mask image. In the four upper lines the galaxy inclination is fixed to i = 60°, whereas the azimuthal angle ϕ with respect to the bar major axis varies. In the lowest line the same model is seen edge-on. The initial values of the simulation contain a small classical bulge with bulge-to-total ratio B/T = 0.075. During the simulation a bar with a vertically thick inner barlens component forms.
Current usage metrics show cumulative count of Article Views (full-text article views including HTML views, PDF and ePub downloads, according to the available data) and Abstracts Views on Vision4Press platform.
Data correspond to usage on the plateform after 2015. The current usage metrics is available 48-96 hours after online publication and is updated daily on week days.
Initial download of the metrics may take a while.