Fig. A.2.
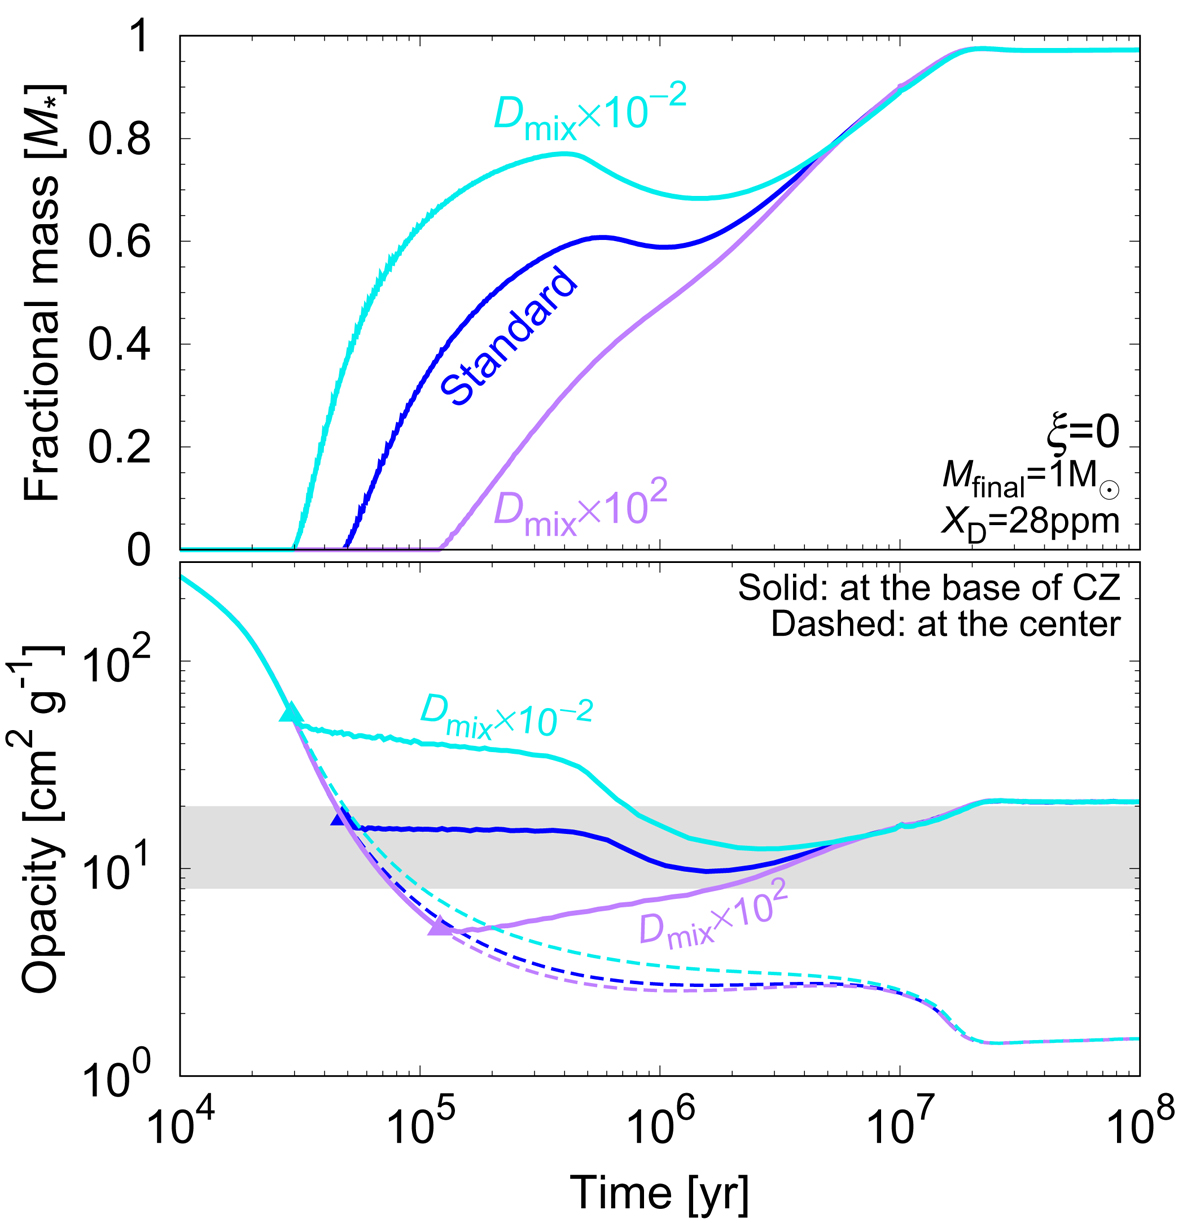
Evolution with time of the fractional mass of the central radiative zone (top panel) and of the internal opacities (bottom), for a 1 M⊙ star, assuming a heat injection parameter ξ = 0 and deuterium mass fraction XD = 28 ppm. The solid and dashed lines indicate values at the base of the surface CZ and at the center, respectively. Three cases are considered: a standard case (blue line), one in which the diffusion coefficient of convective mixing is artificially increased (purple) or decreased (cyan) by a factor of 100. The gray area in the bottom panel indicates the range of values of the critical opacity at the base of the CZ in the standard case (κcrit ~ 10 cm2g−1). The triangles indicate the time at which the radiative zone appears at the center and starts growing.
Current usage metrics show cumulative count of Article Views (full-text article views including HTML views, PDF and ePub downloads, according to the available data) and Abstracts Views on Vision4Press platform.
Data correspond to usage on the plateform after 2015. The current usage metrics is available 48-96 hours after online publication and is updated daily on week days.
Initial download of the metrics may take a while.