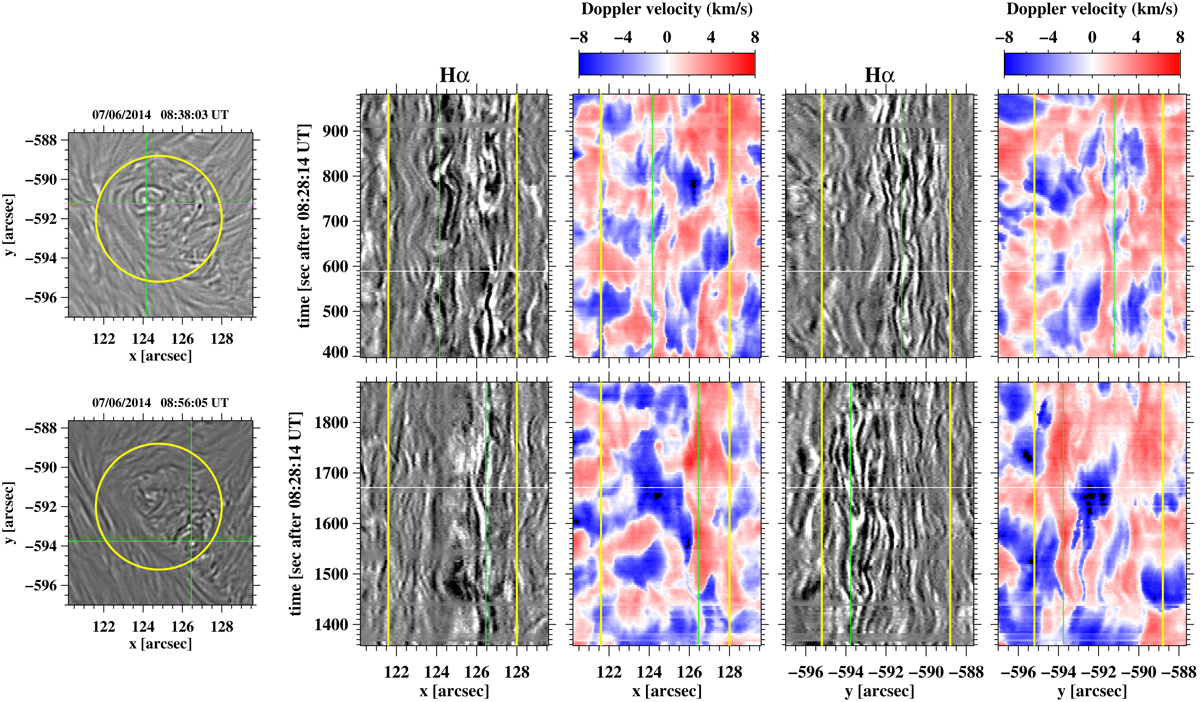
Fig. 9

Unsharp-masked (see text for details) Hα line-centre intensity images (first column) and corresponding time-slice Hα line-centre intensity and Doppler velocity images along the horizontal (Cols. 2 and 3, respectively) and the vertical (Cols. 4 and 5, respectively) slits shown in the first column images as green lines. The two slits pass from the approximate visual centres of the chosen swirls, marked by red and cyan circles in Fig. 4. The yellow circle in the first column images and the yellow vertical lines in the time-slice images indicate the borders of the conspicuous vortex flow; vertical green lines on the time-slice images show the approximate centre position of the respective swirl, while horizontal white lines indicate the time corresponding to the image shown in the first column. In velocity time-slice images negative and positive Doppler velocities indicate upwards and downwards LOS motions, respectively.
Current usage metrics show cumulative count of Article Views (full-text article views including HTML views, PDF and ePub downloads, according to the available data) and Abstracts Views on Vision4Press platform.
Data correspond to usage on the plateform after 2015. The current usage metrics is available 48-96 hours after online publication and is updated daily on week days.
Initial download of the metrics may take a while.


