Fig. 7
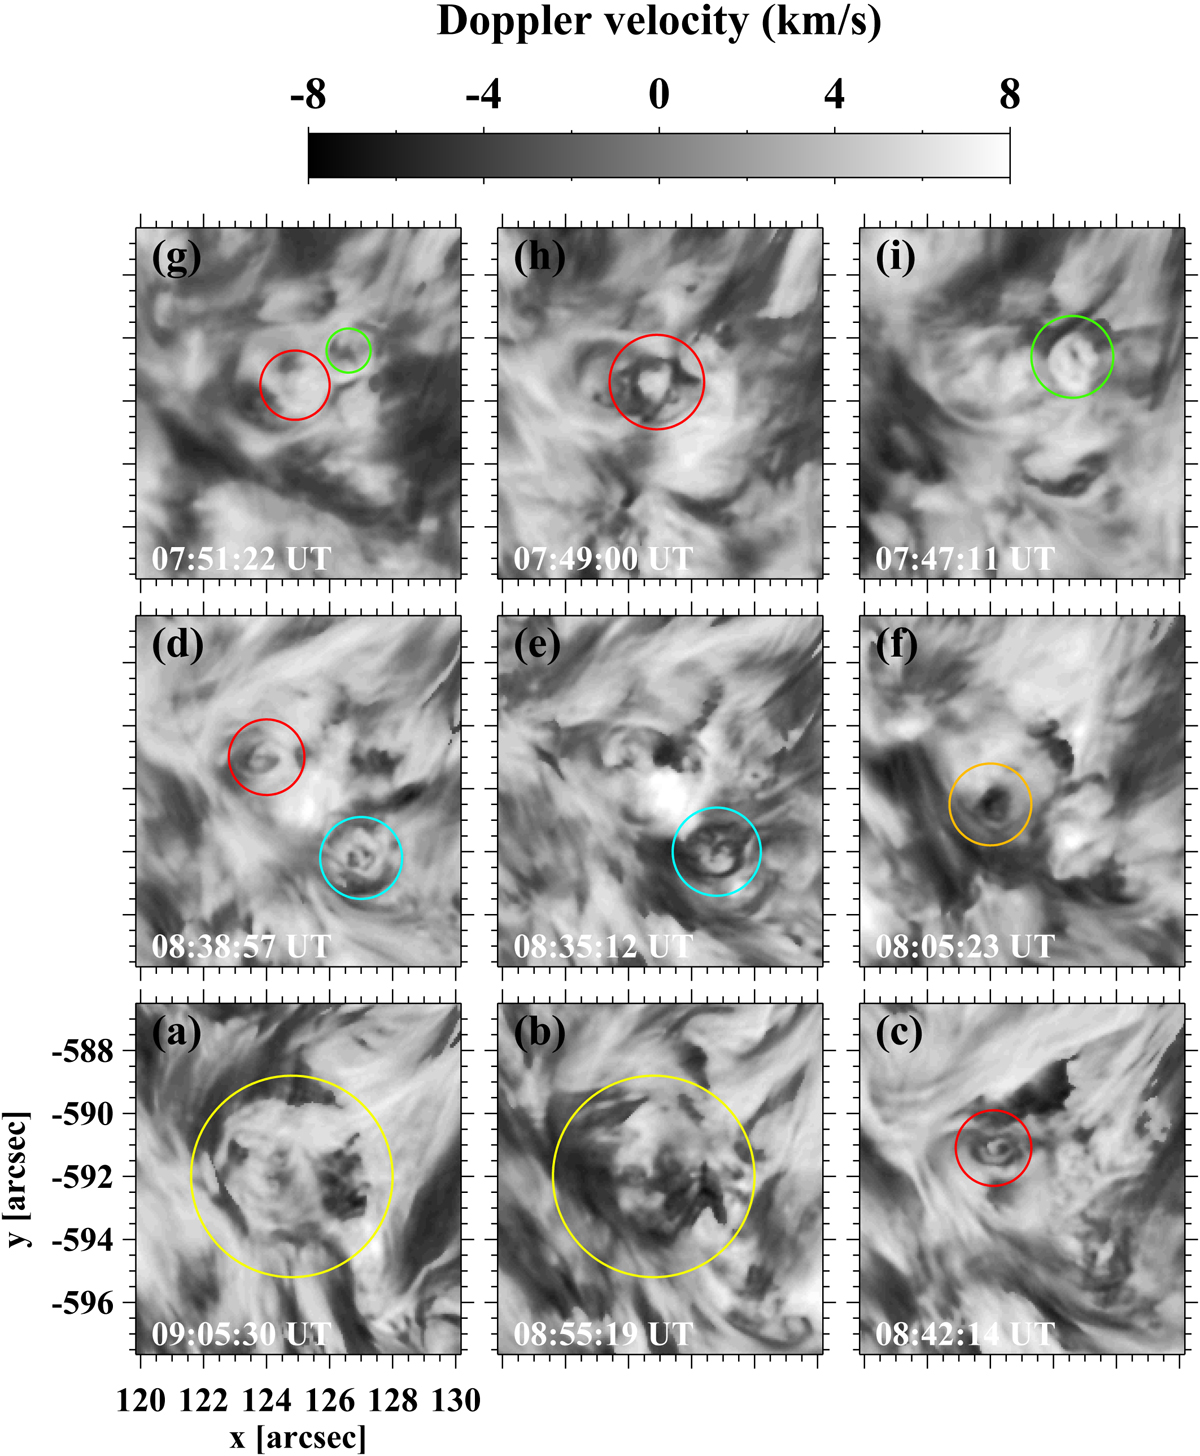
Indicative images of the Doppler velocities derived from the Hα profiles as explained in Sect. 2. Negative and positive Doppler velocities indicate respectively upwards and downwards LOS motions. The yellow circle denotes the conspicuous vortex flow while red, green, cyan, and orange circles (see also Fig. 4) denote smaller observed swirls (see Sect. 3.2). The temporal evolution of Doppler velocity is shown in the right panel of the movie attached to Fig. 4.
Current usage metrics show cumulative count of Article Views (full-text article views including HTML views, PDF and ePub downloads, according to the available data) and Abstracts Views on Vision4Press platform.
Data correspond to usage on the plateform after 2015. The current usage metrics is available 48-96 hours after online publication and is updated daily on week days.
Initial download of the metrics may take a while.