Fig. 5
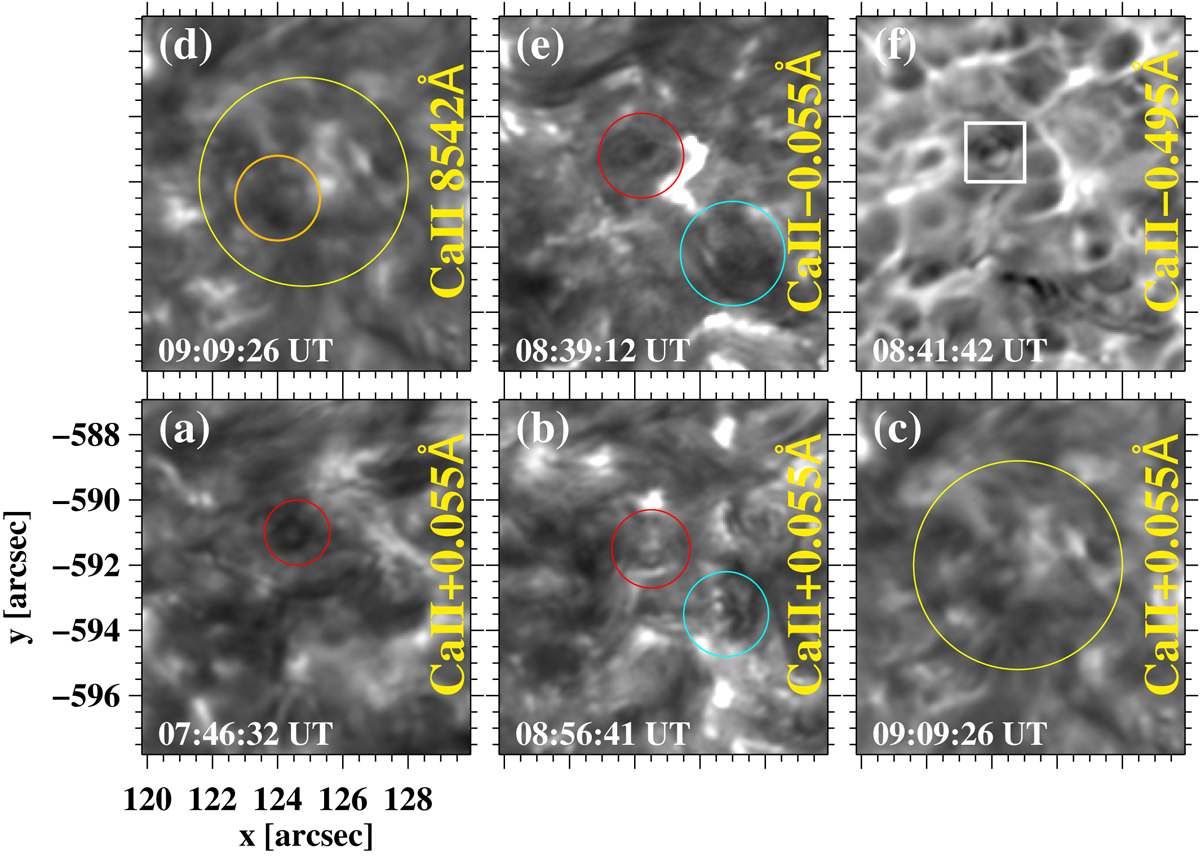
Indicative images of the ROI, almost co-temporal with respective Hα images of Fig. 4, at different wavelengths of the Ca II 8542 Å line. The yellow circle denotes the area of the conspicuous Hα vortex flow (e.g. Fig. 4g) while red, green, and orange circles denote smaller observed swirls also seen in Hα (see panels of Fig. 4) and discussed in Sect. 3.2. The white rectangle in panel f encloses the upflow event also seen in the extreme Hα blue wing (Fig. 4v).
Current usage metrics show cumulative count of Article Views (full-text article views including HTML views, PDF and ePub downloads, according to the available data) and Abstracts Views on Vision4Press platform.
Data correspond to usage on the plateform after 2015. The current usage metrics is available 48-96 hours after online publication and is updated daily on week days.
Initial download of the metrics may take a while.