Fig. 4
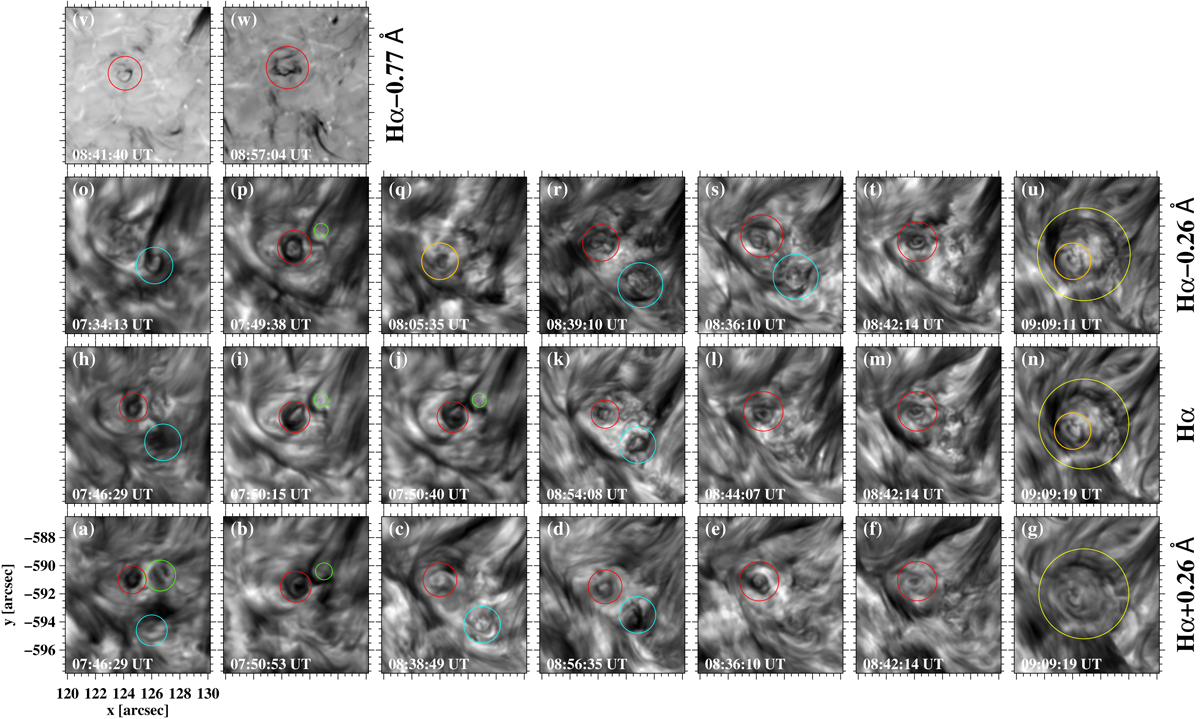
Indicative images of the conspicuous vortex flow (yellow circle) at different times and wavelengths of the Hα line. Red, green, cyan, and orange circles mark the smaller observed swirls discussed in Sect. 3.2 that exhibit different morphological structures and patterns. The temporal evolution of the vortex flow in Hα line-centre intensity is shown in the left panel of the movie available online.
Current usage metrics show cumulative count of Article Views (full-text article views including HTML views, PDF and ePub downloads, according to the available data) and Abstracts Views on Vision4Press platform.
Data correspond to usage on the plateform after 2015. The current usage metrics is available 48-96 hours after online publication and is updated daily on week days.
Initial download of the metrics may take a while.