Fig. 3
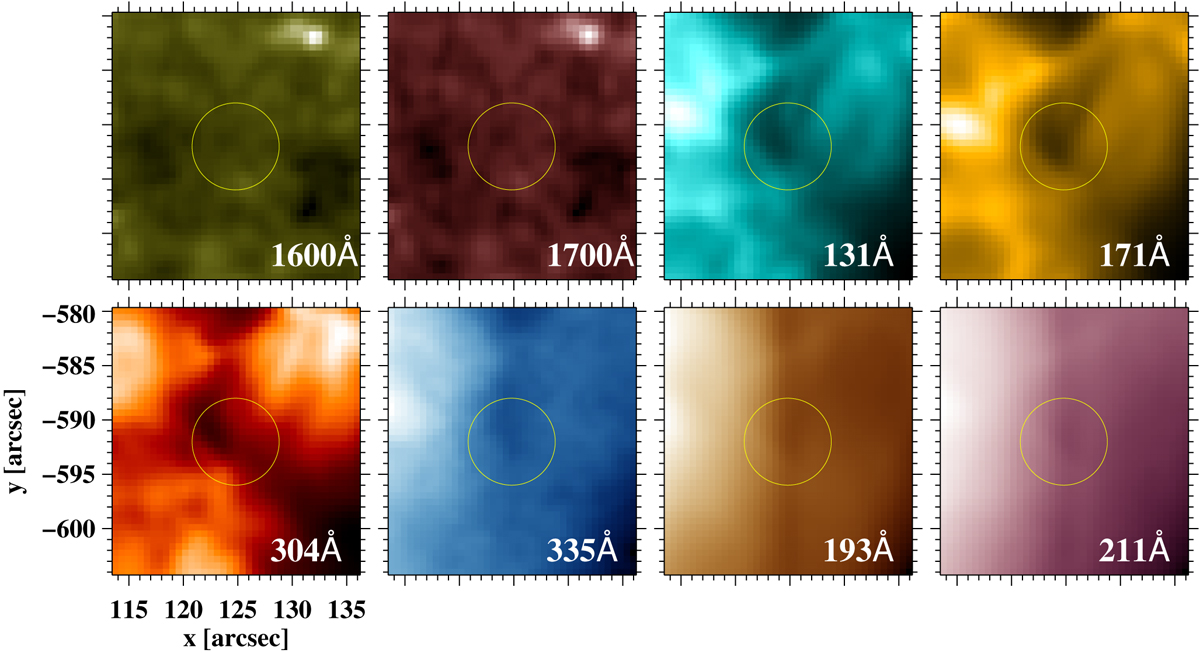
Average (stacked) image of the apparent vortex area in all observed AIA channels mapping increasing temperatures within atmospheric layers from the photosphere to the corona. Averaging has been performed over the entire observing interval of 07:32 UT–08:34 UT for the 1600 Å and 1700 Å channels and 07:32 UT–09:16 UT for all other AIA channels (see Sect. 2). The overplotted yellow circle indicates the location of the analysed conspicuous vortex flow as seen in Hα.
Current usage metrics show cumulative count of Article Views (full-text article views including HTML views, PDF and ePub downloads, according to the available data) and Abstracts Views on Vision4Press platform.
Data correspond to usage on the plateform after 2015. The current usage metrics is available 48-96 hours after online publication and is updated daily on week days.
Initial download of the metrics may take a while.