Fig. 9.
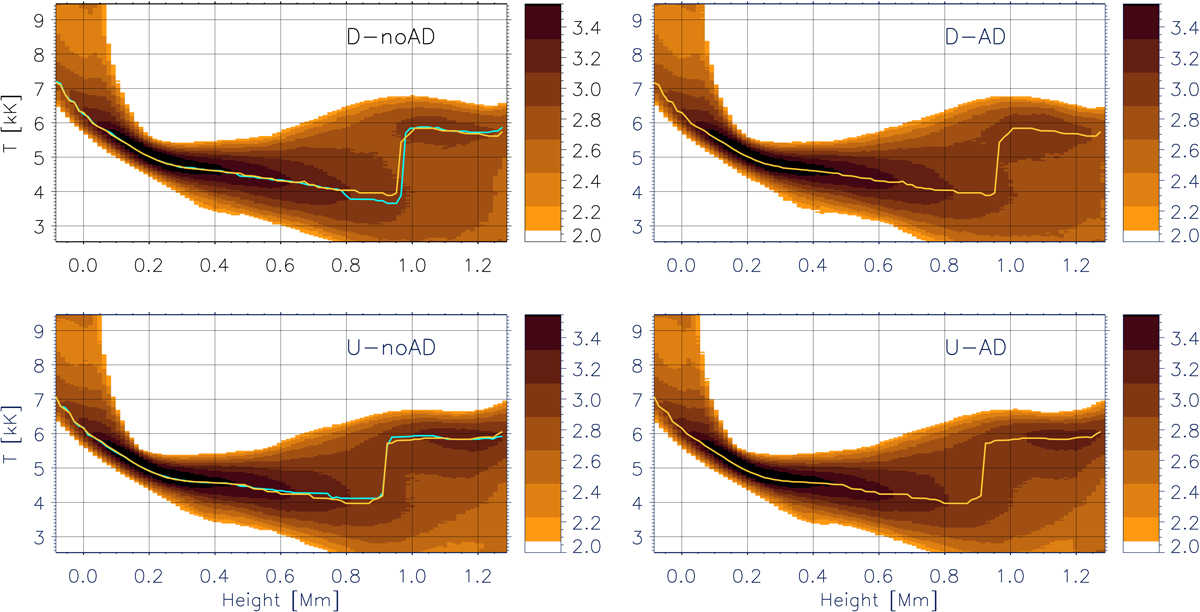
Bidimensional histograms showing the logarithm of the number of points with a given value of temperature at a given height. The darker colors mean larger number of points, indicated at the bar in log10 scale. Upper left panel: D-noAD run; upper right panel: D-AD run; bottom left panel: U-noAD run; bottom right panel: U-AD run. Yellow and light blue lines follow the maximum value of the distribution at each height for AD/noAD runs, correspondingly.
Current usage metrics show cumulative count of Article Views (full-text article views including HTML views, PDF and ePub downloads, according to the available data) and Abstracts Views on Vision4Press platform.
Data correspond to usage on the plateform after 2015. The current usage metrics is available 48-96 hours after online publication and is updated daily on week days.
Initial download of the metrics may take a while.