Free Access
Fig. 6.
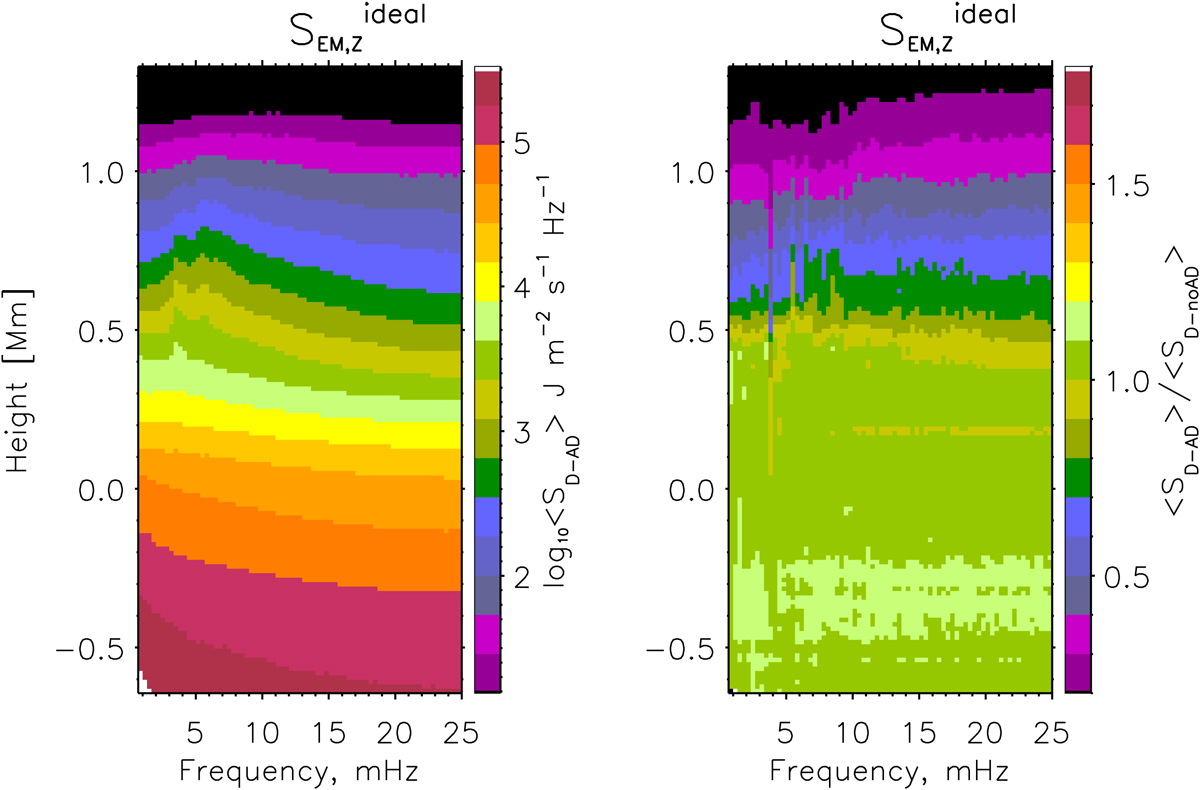
Amplitude spectra of the vertical component of the Poynting flux, ![]() (ideal part), defined by Eq. (14), as a function of height and frequency. Left panel: amplitude map for D-AD run; right panel: ratio of D-AD to D-noAD amplitude maps. The amplitude is shown in log 10 units of J m−2 s−1 Hz−1.
(ideal part), defined by Eq. (14), as a function of height and frequency. Left panel: amplitude map for D-AD run; right panel: ratio of D-AD to D-noAD amplitude maps. The amplitude is shown in log 10 units of J m−2 s−1 Hz−1.
Current usage metrics show cumulative count of Article Views (full-text article views including HTML views, PDF and ePub downloads, according to the available data) and Abstracts Views on Vision4Press platform.
Data correspond to usage on the plateform after 2015. The current usage metrics is available 48-96 hours after online publication and is updated daily on week days.
Initial download of the metrics may take a while.