Free Access
Fig. 4.
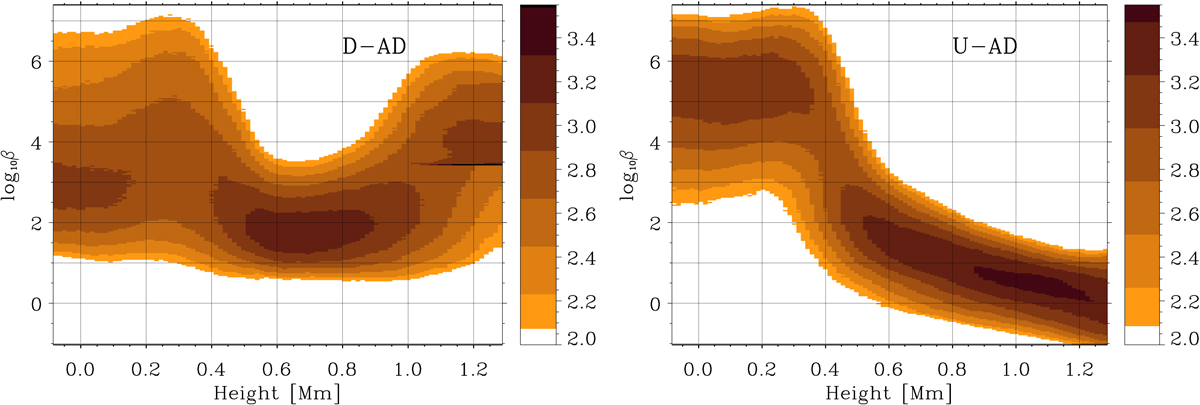
Bidimensional histogram showing the number of occurrences of a given value of plasma β as a function of height in D-AD run (left panel) and U-AD run (right panel). Darker colors mean larger probability of occurrence in logaritmic scale, indicated by the color bar.
Current usage metrics show cumulative count of Article Views (full-text article views including HTML views, PDF and ePub downloads, according to the available data) and Abstracts Views on Vision4Press platform.
Data correspond to usage on the plateform after 2015. The current usage metrics is available 48-96 hours after online publication and is updated daily on week days.
Initial download of the metrics may take a while.