Fig. 3.
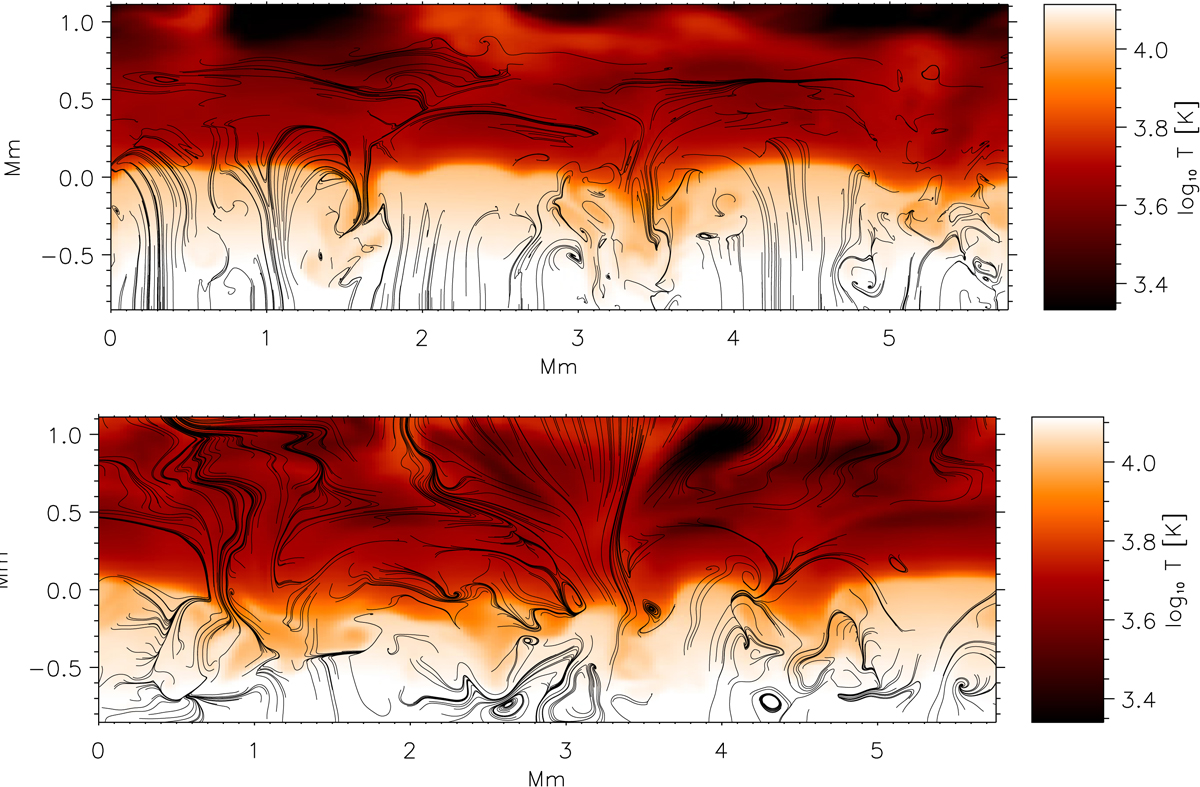
Cuts through the simulation snapshots over horizontal x and vertical z directions. The locations of the cuts are marked in Fig. 2. The color image shows the temperature. The black lines are the projections of the magnetic field lines into the x − z plane. Only the field lines with the average field strength above 5 G are drawn. Top panel: D-AD run; bottom panel: U-AD run.
Current usage metrics show cumulative count of Article Views (full-text article views including HTML views, PDF and ePub downloads, according to the available data) and Abstracts Views on Vision4Press platform.
Data correspond to usage on the plateform after 2015. The current usage metrics is available 48-96 hours after online publication and is updated daily on week days.
Initial download of the metrics may take a while.