Fig. 17.
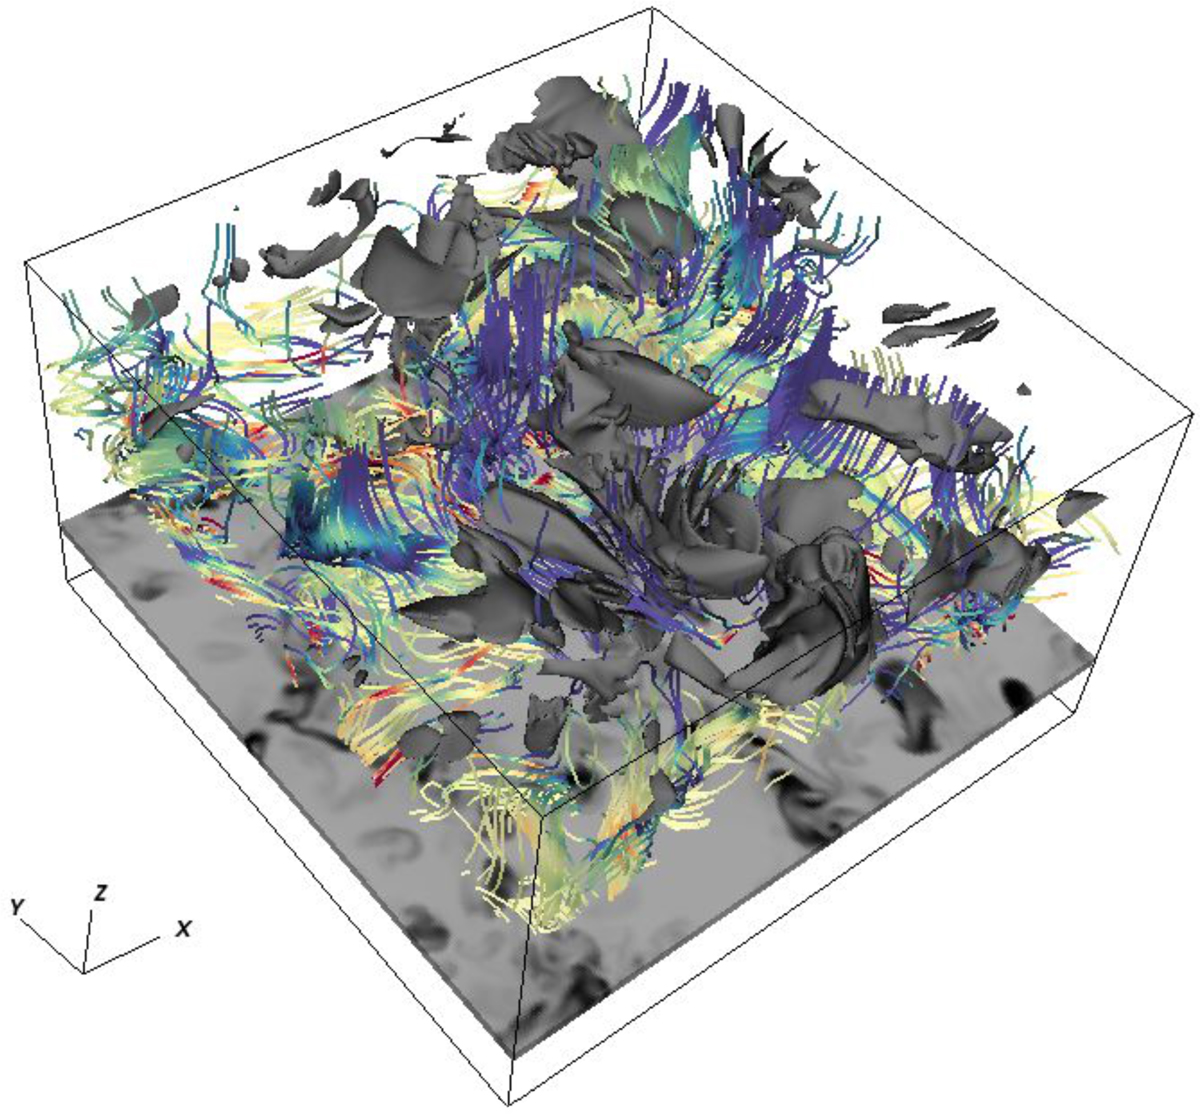
Three-dimensional view of a simulation snapshot of the U-AD run. The grayscale image at the bottom shows temperature at −0.5 Mm, below the surface. Colored lines are magnetic field lines, the colors indicate the vertical magnetic field strength, where blue represents negative polarity, red indicates positive polarity, and yellow represents horizontal field. The gray contours at the upper part of the domain follow regions with the heating term log10(![]() )=8. The movie showing the temporal evolution of the run is available online.
)=8. The movie showing the temporal evolution of the run is available online.
Current usage metrics show cumulative count of Article Views (full-text article views including HTML views, PDF and ePub downloads, according to the available data) and Abstracts Views on Vision4Press platform.
Data correspond to usage on the plateform after 2015. The current usage metrics is available 48-96 hours after online publication and is updated daily on week days.
Initial download of the metrics may take a while.