Fig. 14.
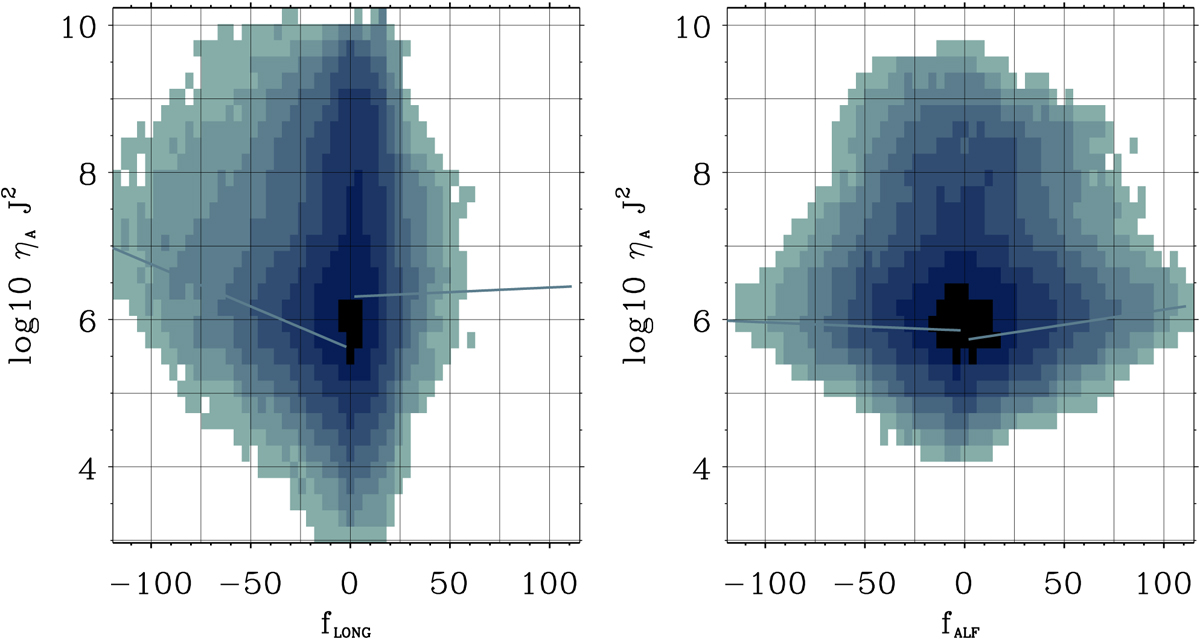
Bidimensional histograms showing the correlation between the heating term and flong (left panel) and falf (right panel), for the U-AD runs. The color scale indicates the log10 of the number of points with a given combination of values at the axes. Inclined solid lines represent the linear fit to the distribution, done separately for positive and negative values.
Current usage metrics show cumulative count of Article Views (full-text article views including HTML views, PDF and ePub downloads, according to the available data) and Abstracts Views on Vision4Press platform.
Data correspond to usage on the plateform after 2015. The current usage metrics is available 48-96 hours after online publication and is updated daily on week days.
Initial download of the metrics may take a while.