Fig. 11.
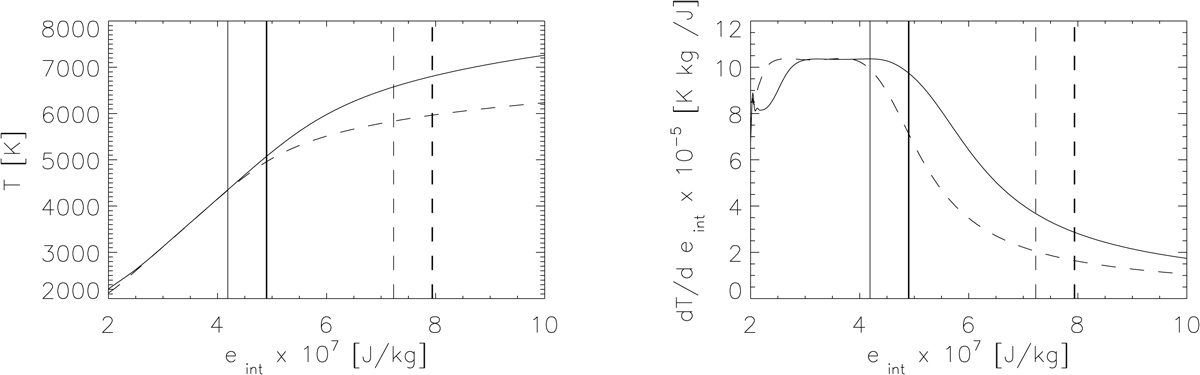
Left panel: cuts through EOS table showing T(eint) for fixed ρ values. The solid line indicates densities corresponding to 600 km and dashed line indicates densities corresponding to 1100 km. The vertical solid and dashed thin lines indicate the values of eint corresponding to 600 and 1100 km. The vertical solid and dashed thick lines represent eint + ηAJ2, taking the same value for ηAJ2 = 107, as per Fig. 10. Right panel: same but for the gradient dT/deint.
Current usage metrics show cumulative count of Article Views (full-text article views including HTML views, PDF and ePub downloads, according to the available data) and Abstracts Views on Vision4Press platform.
Data correspond to usage on the plateform after 2015. The current usage metrics is available 48-96 hours after online publication and is updated daily on week days.
Initial download of the metrics may take a while.