Fig. 9.
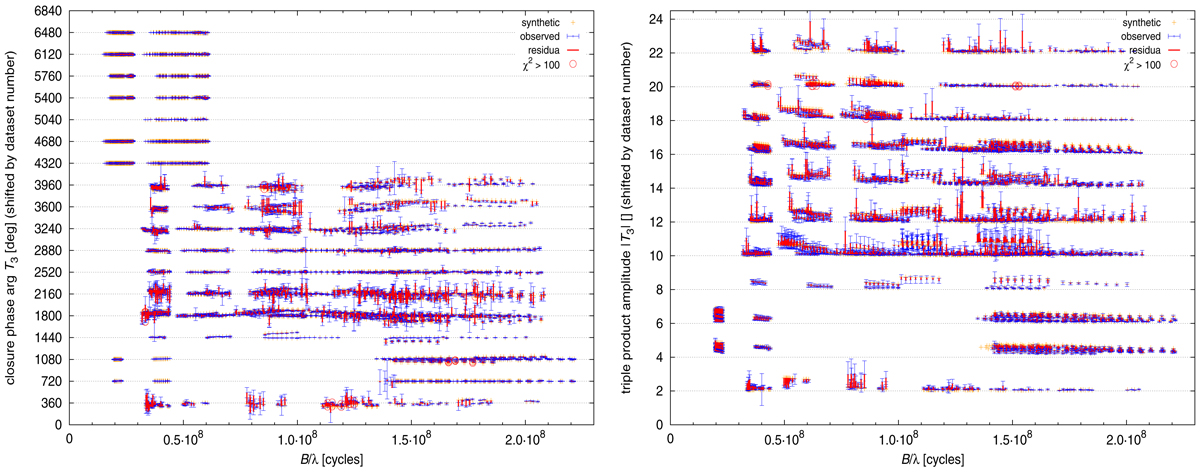
Similar comparison as in Fig. 8, but for closure phases T3ϕ (left) and triple product amplitudes |T3| (right). Contributions to the total χ2 are ![]() , and
, and ![]() . As before, the values are plotted against projected baseline B/λ. T3ϕ measurements were available for NPOI (top half) and CHARA/MIRC (bottom half), while only |T3| from MIRC instrument were used.
. As before, the values are plotted against projected baseline B/λ. T3ϕ measurements were available for NPOI (top half) and CHARA/MIRC (bottom half), while only |T3| from MIRC instrument were used.
Current usage metrics show cumulative count of Article Views (full-text article views including HTML views, PDF and ePub downloads, according to the available data) and Abstracts Views on Vision4Press platform.
Data correspond to usage on the plateform after 2015. The current usage metrics is available 48-96 hours after online publication and is updated daily on week days.
Initial download of the metrics may take a while.