Fig. 8.
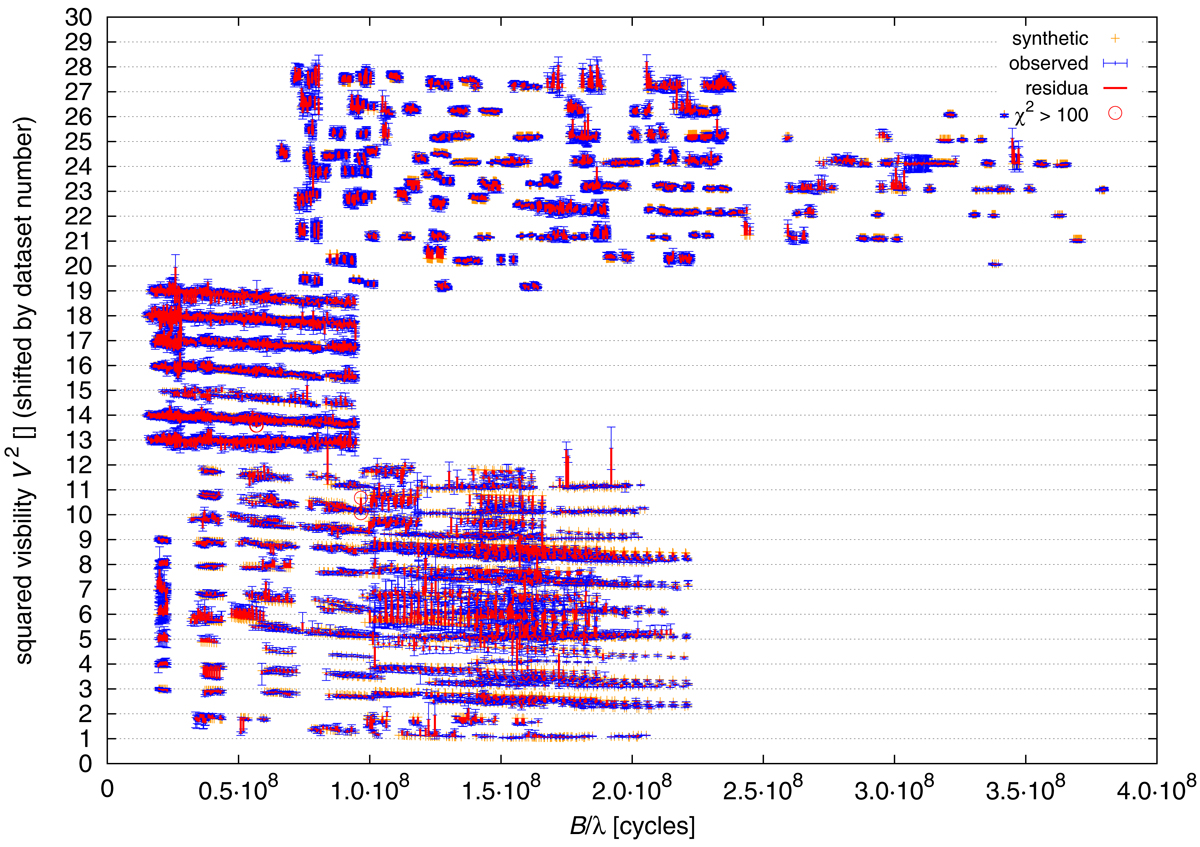
Similar comparison as in Fig. 7, but for squared visibilities |V|2, with a contribution ![]() . The |V|2 values are plotted against projected baseline B/λ (in cycles), and shifted vertically according to the dataset number. The are CHARA/MIRC data at the bottom, NPOI in the middle, and CHARA/VEGA at the top. Synthetic data are denoted by yellow crosses, observed data by blue error bars, and residua by red lines. A few outliers with large uncertainties, which do not contribute much to χ2 anyway, were purposely removed from the plot to prevent clutter. Even though there are some systematic differences for individual segments of data, overall trends seem to be correctly matched.
. The |V|2 values are plotted against projected baseline B/λ (in cycles), and shifted vertically according to the dataset number. The are CHARA/MIRC data at the bottom, NPOI in the middle, and CHARA/VEGA at the top. Synthetic data are denoted by yellow crosses, observed data by blue error bars, and residua by red lines. A few outliers with large uncertainties, which do not contribute much to χ2 anyway, were purposely removed from the plot to prevent clutter. Even though there are some systematic differences for individual segments of data, overall trends seem to be correctly matched.
Current usage metrics show cumulative count of Article Views (full-text article views including HTML views, PDF and ePub downloads, according to the available data) and Abstracts Views on Vision4Press platform.
Data correspond to usage on the plateform after 2015. The current usage metrics is available 48-96 hours after online publication and is updated daily on week days.
Initial download of the metrics may take a while.